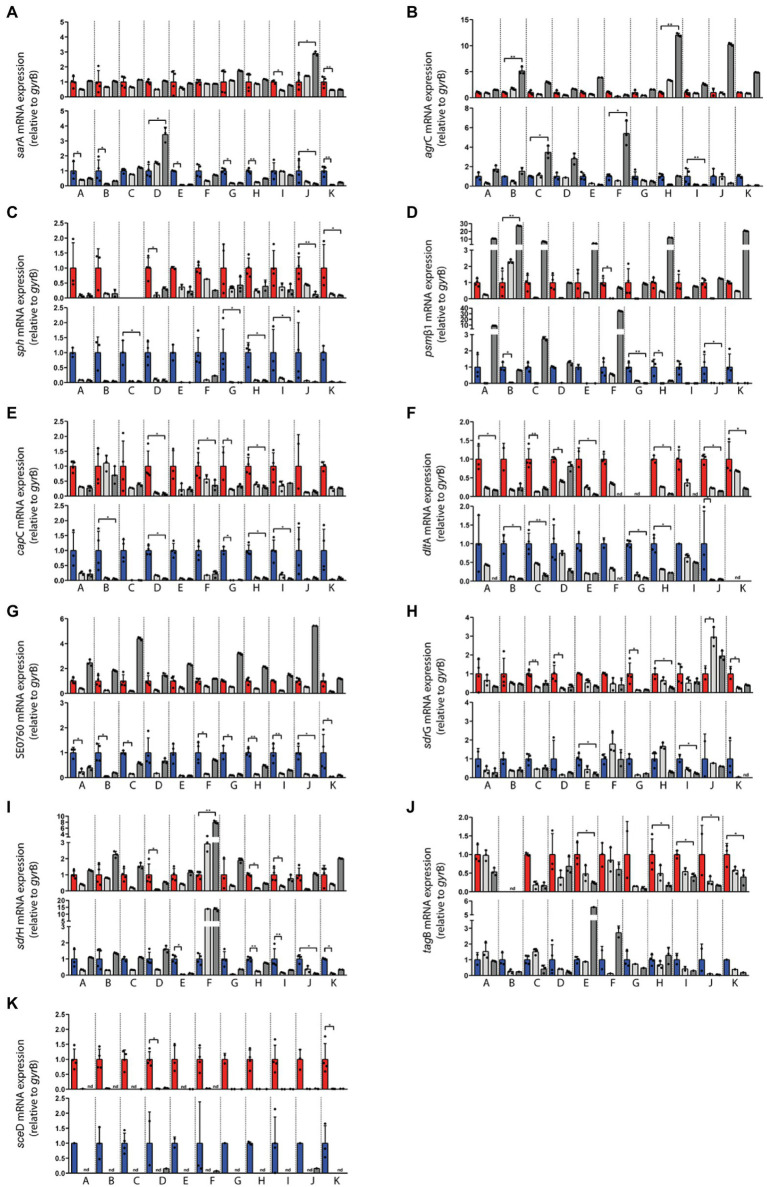
Figure 4.
Transcriptional analysis of the indicated Staphylococcus epidermidis genes in swab material of the nose and skin of 11 healthy individuals (A–K). Expression levels in nose swabs (upper panels, red columns) and skin swabs (lower panels, blue columns) as well as during exponential growth in vitro (light gray) and post-exponential growth in vitro (dark gray) were normalized to the expression level of the house keeping gene gyrB. Values from four independent samplings (four swabs) were used to calculate the mean expression in vivo. In vitro values represent technical replicates from one cultivation. The in vitro values were normalized to the respective in vivo level (set to 1). Statistically significant differences are indicated. *p ≤ 0.05; **p ≤ 0.01. Relative transcription of (A) sarA, (B) agrC, (C) sph, (D) psmβ1, (E) capC, (F) dltA, (G) SE0760, (H) sdrG, (I) sdrH, (J) tagB, and (K) sceD. Gene name abbreviations, see Supplementary Table 2.

