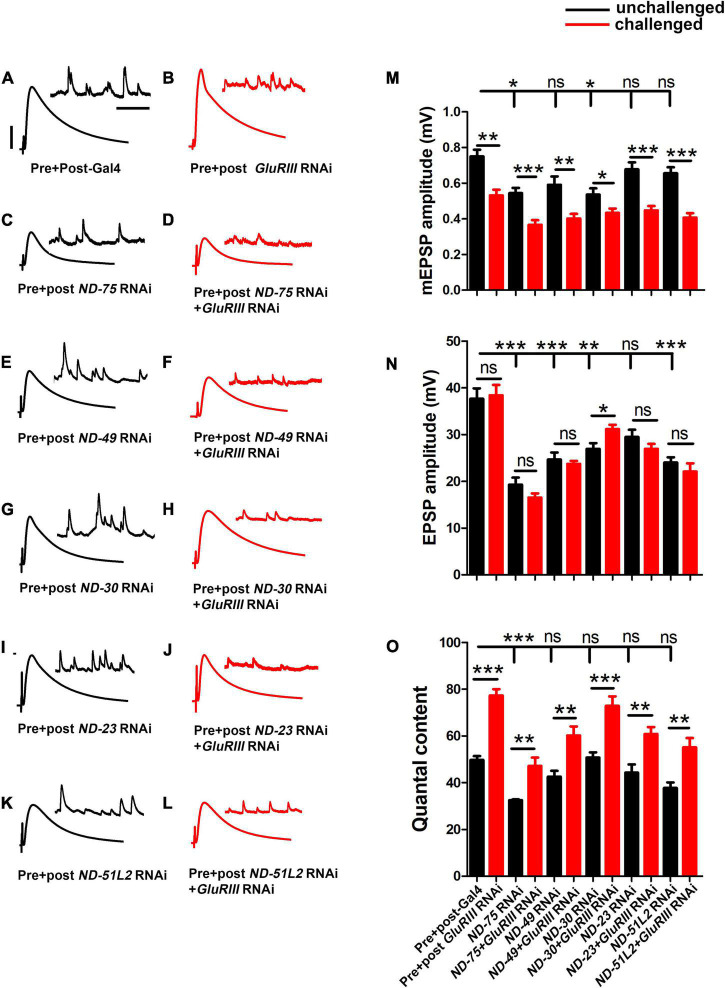
FIGURE 3.
Core complex I subunits regulate neurotransmission. (A–L) Representative traces for pre + post-Gal4 driven knockdown of Mitochondrial Complex I subunits in the presence and absence of GluRIII RNAi. Scale bars for EPSPs (mEPSPs) are x = 50 ms (1000 ms) and y = 10 mV (1 mV). (M–O) Histogram showing average mEPSP, EPSPs amplitude and quantal content in pre + post-Gal4 control, pre + post-Gal4 driven GluRIII RNAi, pre + post-Gal4 driven MCI subunits and pre + post-Gal4 driven GluRIII RNAi and MCI RNAi core subunits in the indicated genotypes. At least 8 NMJ recordings of each genotype were used for quantification. The knockdown experiments and electrophysiology recordings were performed at 25°C. Pre- and postsynaptic RNAi corresponding to MCI subunits were analyzed for EPSPs through electrophysiological recordings. p-values for EPSPs are indicated in Supplementary Table 2. Statistical analysis based on Student’s t-test for pairwise comparisons (in determining homeostatic potentiation for a specific genotype), or one-way ANOVA followed by post hoc Tukey’s multiple comparisons (if comparing back to control across genotypes in the dataset). Error bars represent mean ± s.e.m. *, **, and *** denote the statistical significance with a specific p-value. The p-values are listed in Supplementary Table S2.

