. 2022 May 3;36(3):1408–1415. doi: 10.21873/invivo.12845

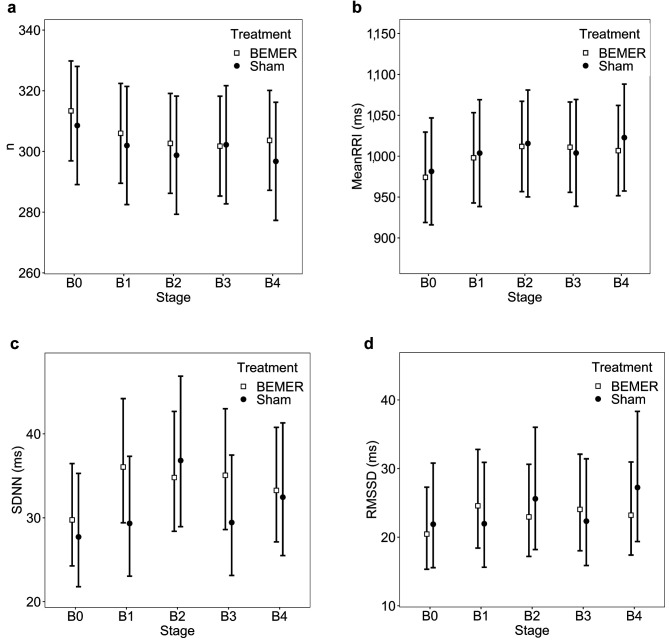
Figure 1. Conformation of the number (n) of detected peaks (a) and the time domain parameters: Mean pulse rate interval (MeanRR) (b), standard deviation of NN-intervals (SDNN, c), and the root mean square of successive RR-interval differences (RMSSD, d). There are no significant differences in the change from baseline level between the treatment (BEMER) and sham groups, however, SDNN and RMSSD show tendency of elevated variability on the beginning of exposure in the real treatment group and one stage later a milder increase in the sham group. There are no statistically significant changes from baseline either in the treatment (BEMER) or in the sham group; however, SDNN and RMSSD show a tendentiously elevated variability at the onset of exposure in the treatment group and, in the sham group, they show a slight increase one stage later. The error bars represent the 95% confidence intervals.

Figure 1