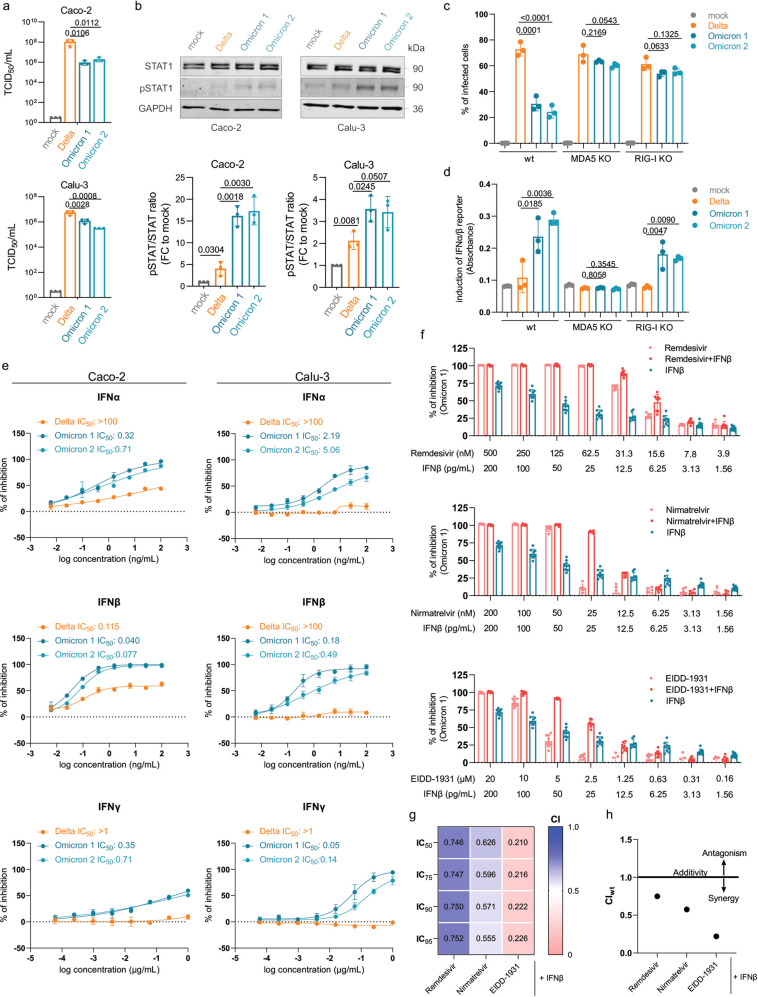
Fig. 1. IFN signaling and therapy during infection with novel SARS-CoV-2 variant Omicron.
a Caco-2 and Calu-3 cells were infected with SARS-CoV-2 variant Delta (GenBank ID: MZ315141), Omicron 1 (GenBank ID: OL800702), and Omicron 2 (GenBank ID: OL800703) at an MOI of 1. The infectious titer was determined 24 h post infection. Graphs represent means ± SD of three biological replicates. Statistically significant differences were identified by one-way ANOVA and subsequent Dunnett’s test. b Immunoblot analysis of total and phosphorylated STAT1 in SARS-CoV-2-infected Caco-2 (left panel) and Calu-3 (right panel) cells 24 h post infection. The protein levels were quantified by ImageJ. Graphs represent means ± SD of three biological replicates. P values were calculated using Student’s t test. c A549-ACE2/TMPRSS2 MDA5/RIG-I-WT (wt), A549-ACE2/TMPRSS2 MDA5 KO (MDA5 KO), and A549-ACE2/TMPRSS2 RIG-I KO (RIG-I KO) cells were infected with Delta, Omicron 1, and Omicron 2 variants at an MOI of 0.01 for 72 h. The number of infected cells was determined by immunofluorescence staining. Graphs represent data of four biological replicates. Statistically significant differences were identified by one-way ANOVA and subsequent Dunnett’s test. d Production of IFNα/β was measured by incubating supernatants from wt, MDA5-KO, and RIG-I KO cells infected with SARS-CoV-2 variants at an MOI of 0.01 for 48 h using HEK-Blue IFNα/β reporter cells. Graphs displays means ± SD of three biological replicates. Statistically significant differences were identified by one-way ANOVA and subsequent Dunnett’s test. e Dose–response curves of IFNα, IFNβ, and IFNγ were determined in Caco-2 and Calu-3 cells. All IFNs were added to confluent monolayers and subsequently infected with viral variants at an MOI of 0.01. The inhibition rate was evaluated 24 h (Caco-2) and 48 h (Calu-3) post infection by staining for the spike protein. Graphs depict means ± SD of three biological replicates. f Antiviral effect of IFNβ in combination with nirmatrelvir, remdesivir, or EIDD-1931 in Caco-2 cells. Statistically significant differences were identified by one-way ANOVA and subsequent Dunnett’s test. g Heatmap of combination indexes (CIs) for IC50, IC75, IC90, and IC95. h Dots depict weighted average (CIwt) calculated according to the formula: CIwt = (CI50 + 2CI75 + 3CI90 + 4CI95)/10. CIwt < 1 synergism, CIwt = 1 additive effects, CIwt > 1 antagonism.

