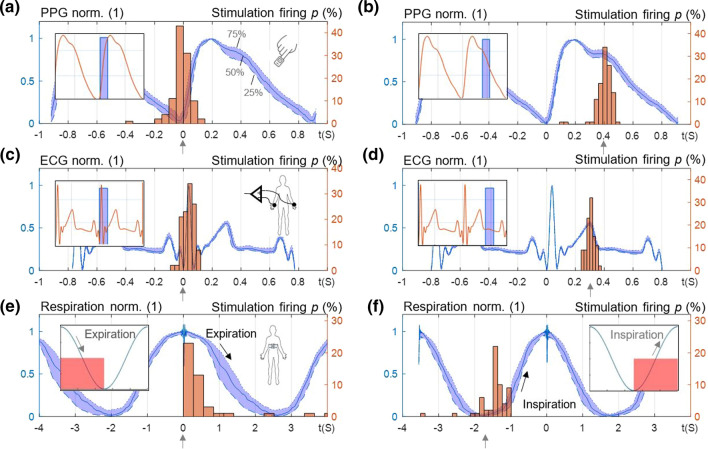
Fig. 7.
Auricular stimulation synchronized with three different biosignals, i.e., PPG, ECG and respiration. a, b The distribution of PPG from the finger over the recording duration (interquartile range, in blue) and the density distribution of the stimulation on-sets (in red) with a zero delay and b 0.4 s delay with respect to the end of the diastolic valley (insets show stimulation bursts along PPG during calibration). The target time instant is marked with arrows. c, d The distribution of ECG and the density distribution of the stimulation on-sets with c zero delay and d 0.3 s delay with respect to Q-Peak of ECG. e, f The distribution of respiration signal and the density distribution of the stimulation on-sets with respect to e start of expiration phase and f start of inspiration phase. The results are given for the experimental setup

