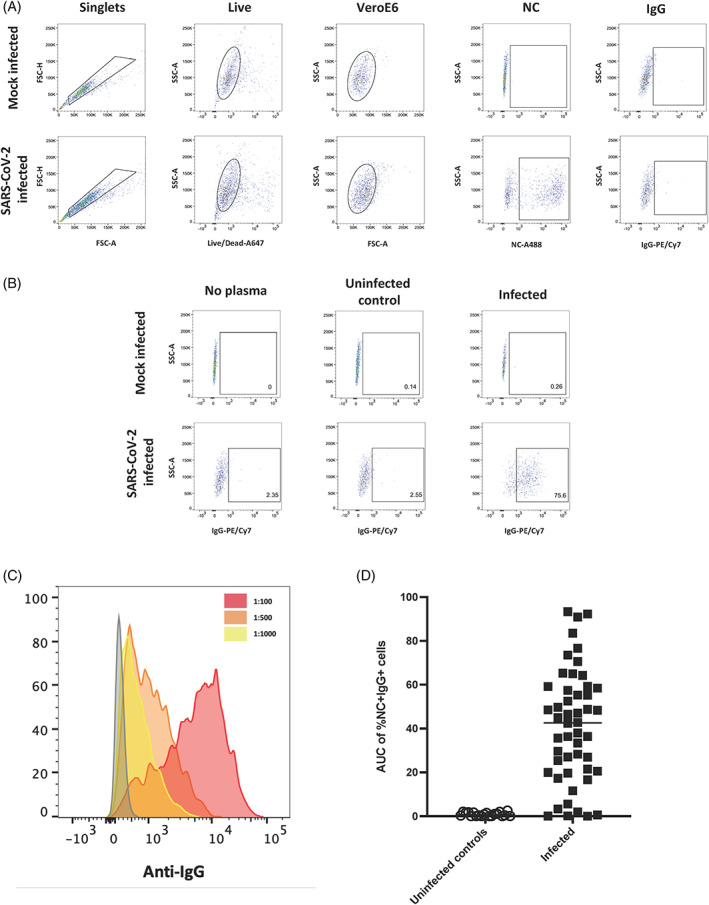
FIGURE 3.

Quantitating binding of antibodies to SARS‐CoV‐2‐infected cells using flow cytometry. A gating strategy identifying singlets, live cells and Vero E6 cells was used to detect cells followed by gating for the presence of Nucleocapsid and IgG on mock infected and SARS‐CoV‐2‐infected cells (A). No plasma, plasma from an uninfected individual and plasma from an infected individual were used to assess specificity of antibody binding to mock infected and SARS‐CoV‐2‐infected cells (B). A histogram of events acquired using plasma from an infected individual which was diluted to three different dilutions (1:100, red; 1:500, orange and 1:1000, yellow) (C). The AUC of %NC + IgG+ cells at three dilutions (1:100, 1:500 and 1:1000) was calculated for uninfected controls (n = 20) and SARS‐CoV‐2‐infected individuals (n = 50) (D) [Color figure can be viewed at wileyonlinelibrary.com]
