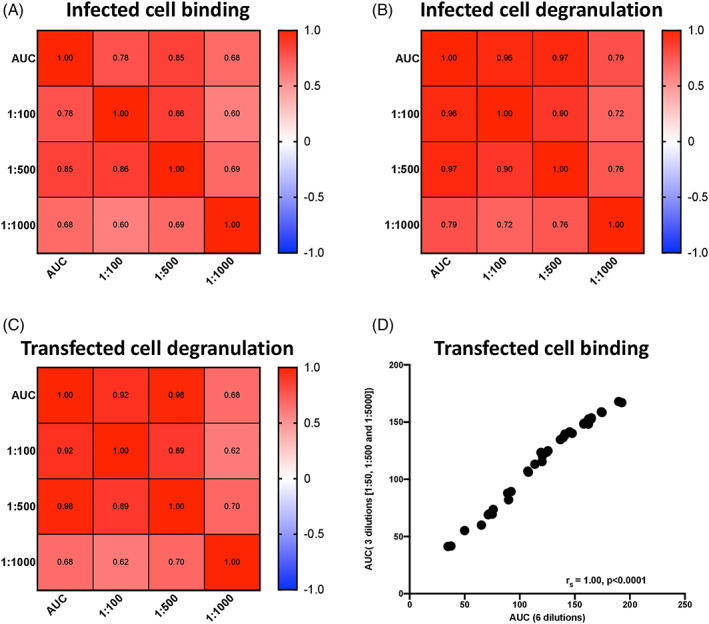
FIGURE 7.

Correlations between single or reduced dilutions and AUC for infected cell binding and antibody‐mediated NK cell degranulation assays. The relationship between the AUC of three dilutions of antibody and single dilutions in infected cell binding (A), infected cell degranulation (B) and transfected cell degranulation (C) were determined using a spearman test. The relationship between the AUC of transfected cell binding at three dilutions (50, 500 and 5000) and six dilutions (50, 100, 500, 1000, 5000 and 10,000) was plotted and determined using a spearman test (D) [Color figure can be viewed at wileyonlinelibrary.com]
