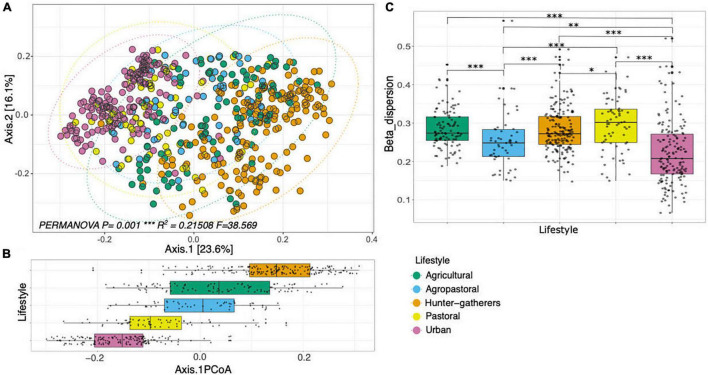
FIGURE 2.
Beta diversity analysis of human gut microbiome between lifestyles. (A) Principal Coordinates Analysis (PCoA) with unweighted UniFrac distance at the family level. (B) Boxplots of the distribution of each lifestyle across axis 1 of the PCoA. (C) Boxplot of the Multivariate Beta Dispersion analysis comparison of different lifestyles. Asterisks denote statistical significant differences given by Wilcoxon rank-sum test (*p < 0.05, **p < 0.01, ***p < 0.001, ****p < 0.0001).

