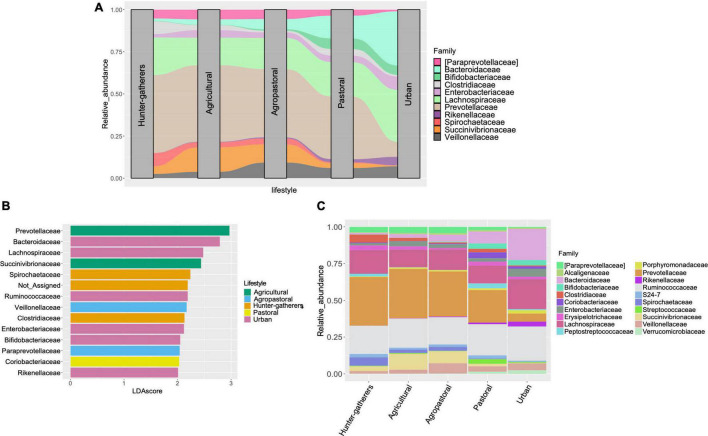
FIGURE 3.
Differentially abundant bacterial families between lifestyles. (A) Alluvial plot representing the differentially abundant families among lifestyles according to LEfSe and DEseq2 analyses. (B) Linear Discriminant Analysis with Effect Size (LEfSe) at the family level between lifestyles. Only features with LDA score higher than 2.0 and p < 0.05 were included. (C) Stacked barplot of relative abundance of the top 20 most abundant bacterial families in each lifestyle.

