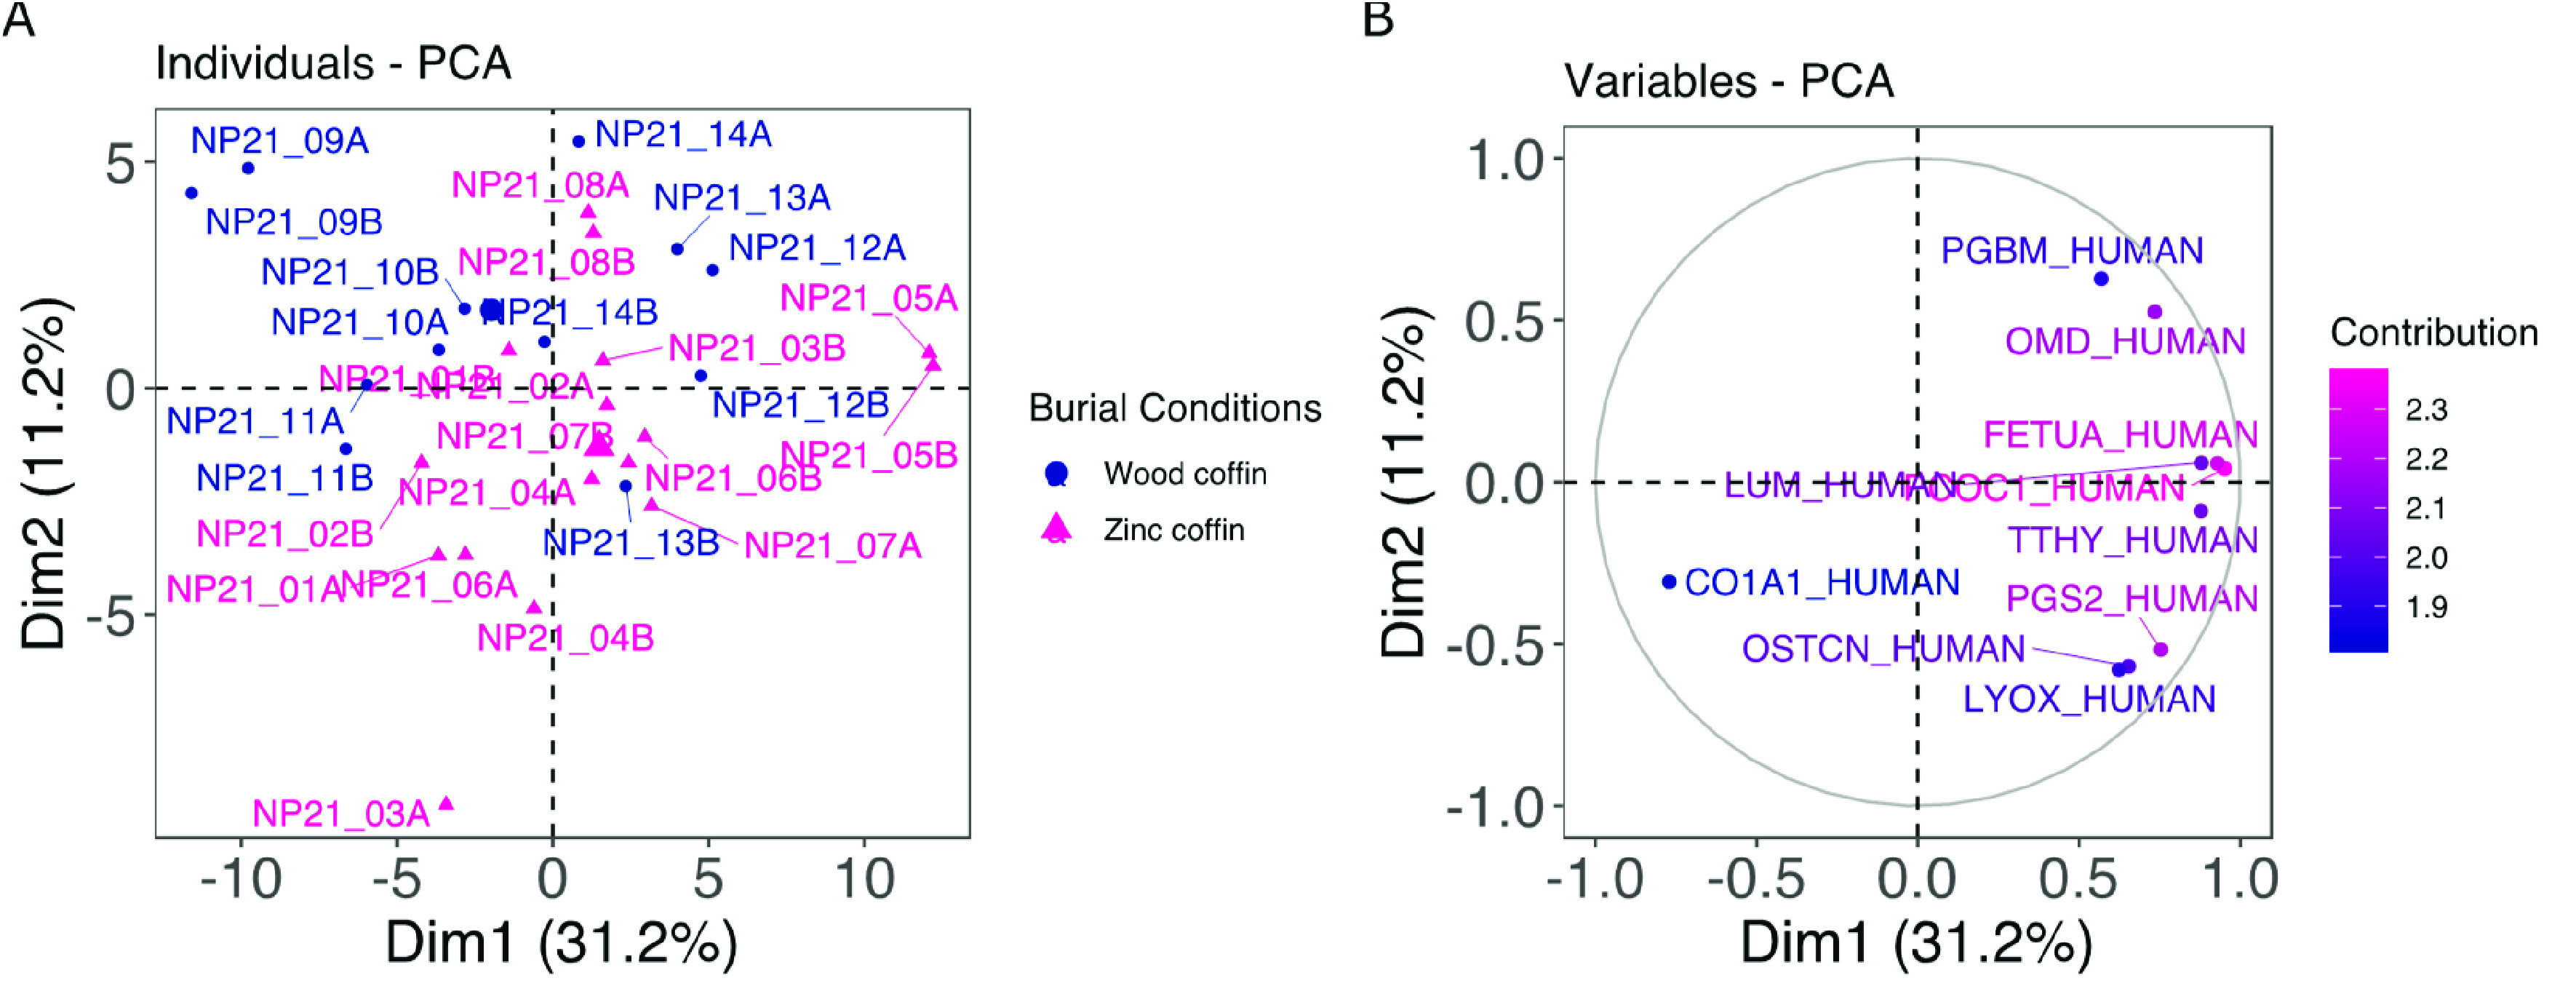
Figure 2.

PCA plot showing (A) the individual clustering according to the two burial conditions (blue dots for wooden coffins and magenta triangles for zinc-lined coffins, reported, respectively, as “wood coffin” and “zinc coffin” in the figure) and (B) the relative abundance of the 10 proteins that provided the highest contribution in the clustering.
