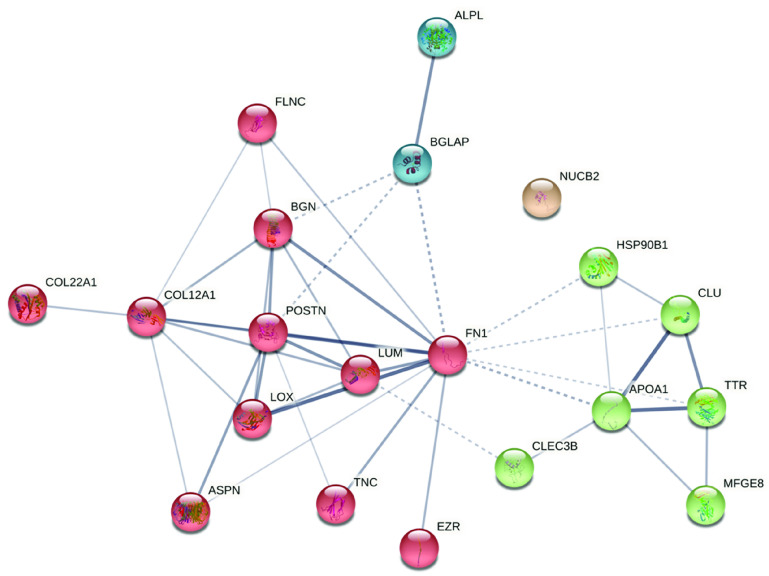
Figure 4.
STRING diagram of the proteins that shows the significant difference between the two burial conditions. The clusters show the presence of bone proteins (blue), collagen and collagen-binding proteins (red), also involved in bone metabolism, and plasma and blood proteins (green). NUCB2 is the only protein dissociated from the group. The line thickness indicates the strength of data support (edge confidence). K means clustering was used to visualize clusters (k = 4).

