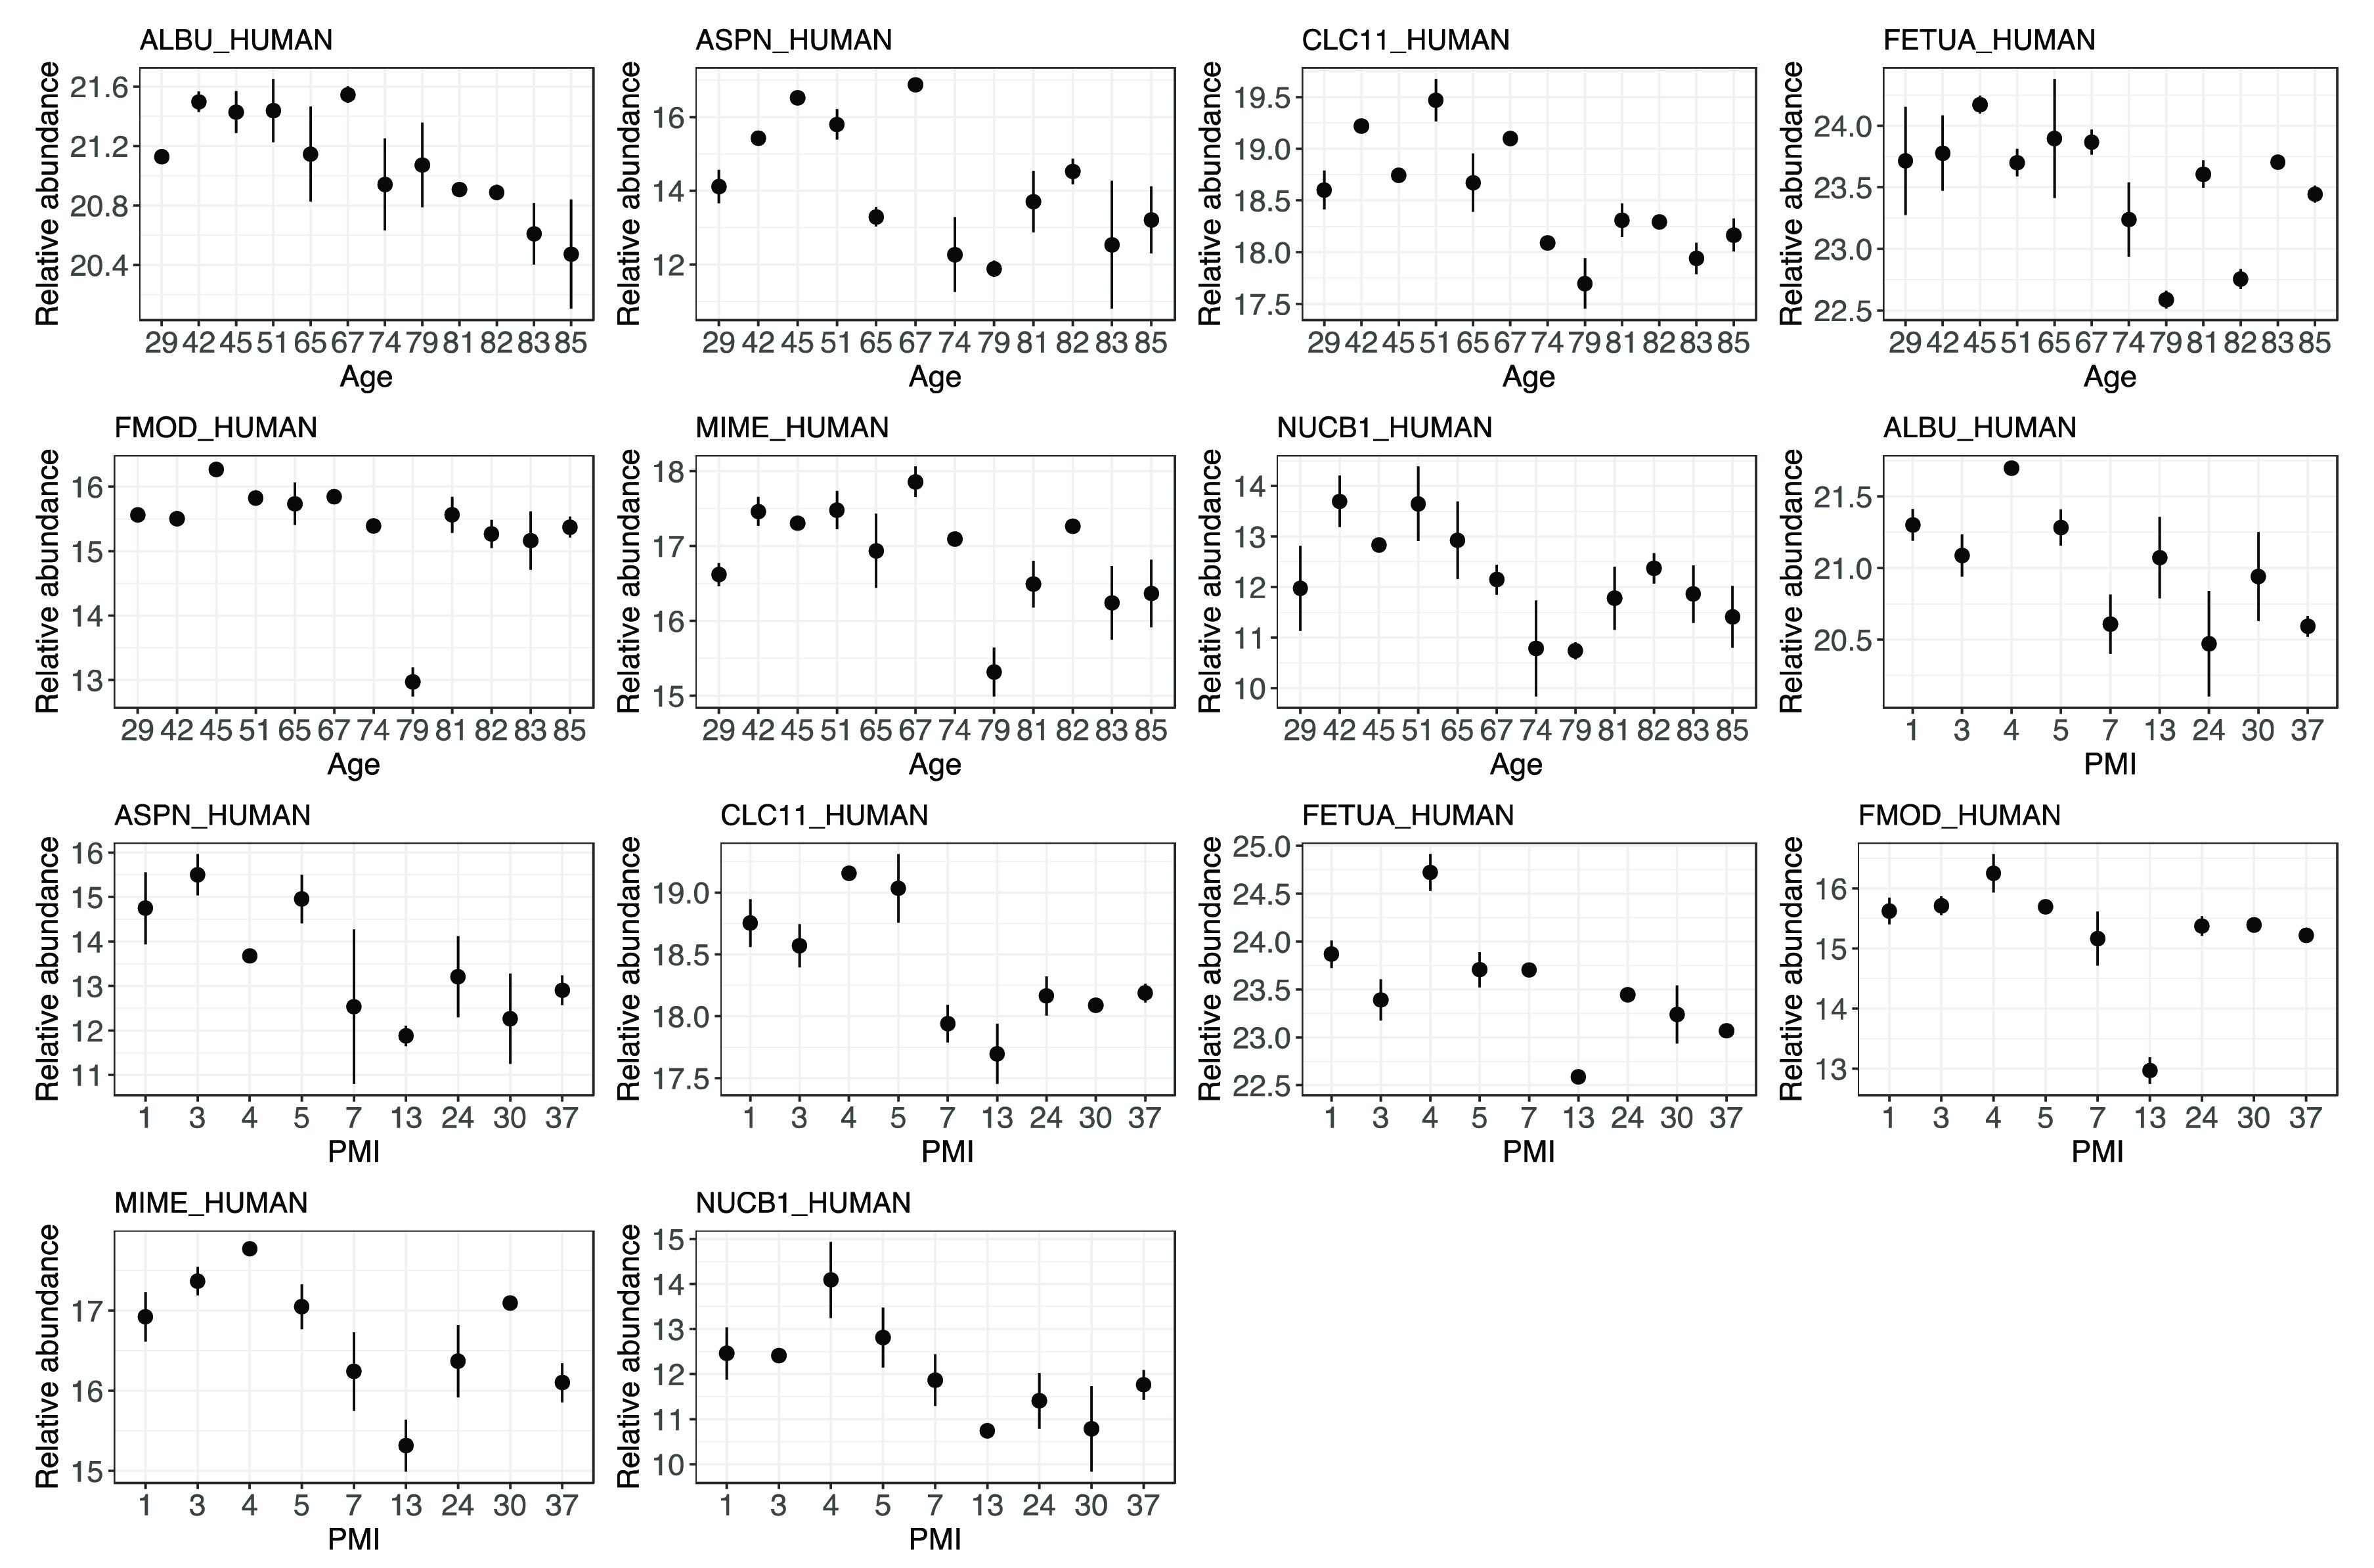
Figure 7.

Error plots of the protein abundances showing a significant negative correlation with both age and PMI when n = 28 samples are included in the calculation. The first seven plots show the relationship with age, whereas the second seven plots show the correlation of the same protein relative abundances with PMI. Correlation coefficients and significance can be found in Supplementary Table S2.
