
FIGURE 5.
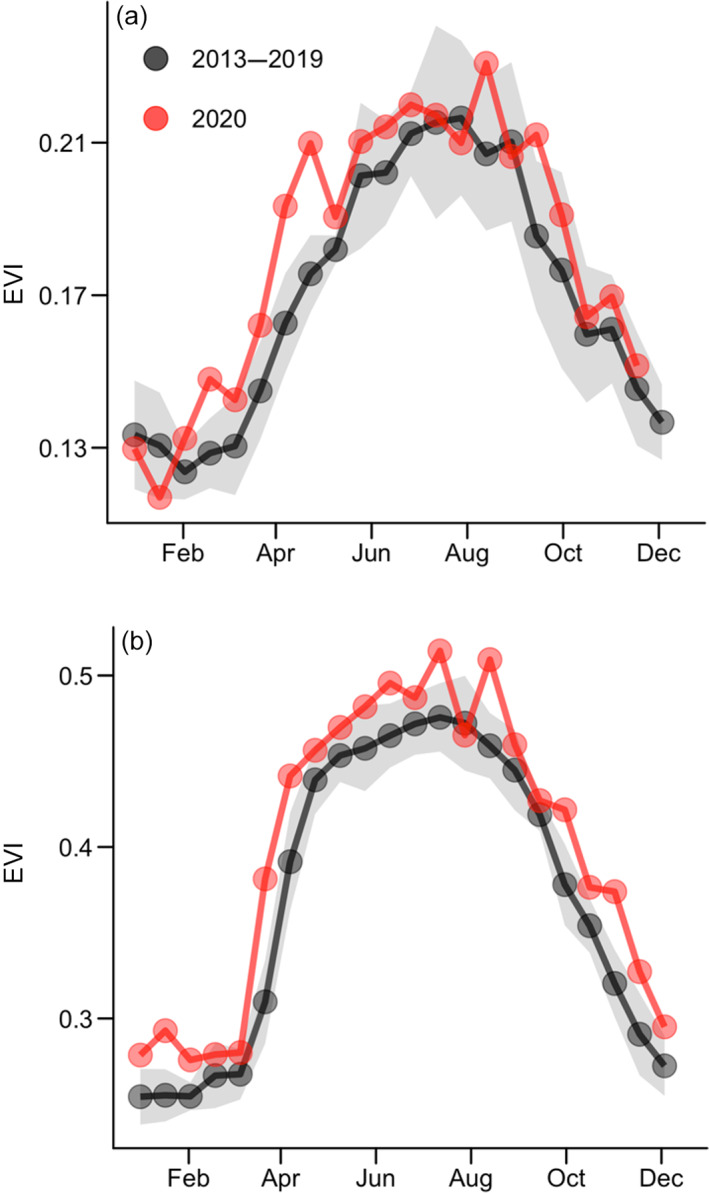
Sixteen‐day mean enhanced vegetation index (EVI) for estuarine and marine wetlands within the Georgia Coastal Ecosystems Long Term Ecological Research (LTER) domain (USFWS National Wetland Inventory) (a). EVI is a well‐recognized index for evaluating vegetation “greenness,” and was derived from NASA MODIS MOD90GA surface reflectance. Wetland MODIS pixels were filtered following O'Connell et al. (2017) to remove intermittent tidal flooding effects on spectral reflectance. (b) Cropland EVI time series sampled from the coastal plain region of Georgia. The uninterrupted green‐up in croplands in spring 2020 is indicative of a reduction in human interventions (e.g., harvesting). Data for 2013–2019 are represented as means (black points) and SDs (gray shaded region)