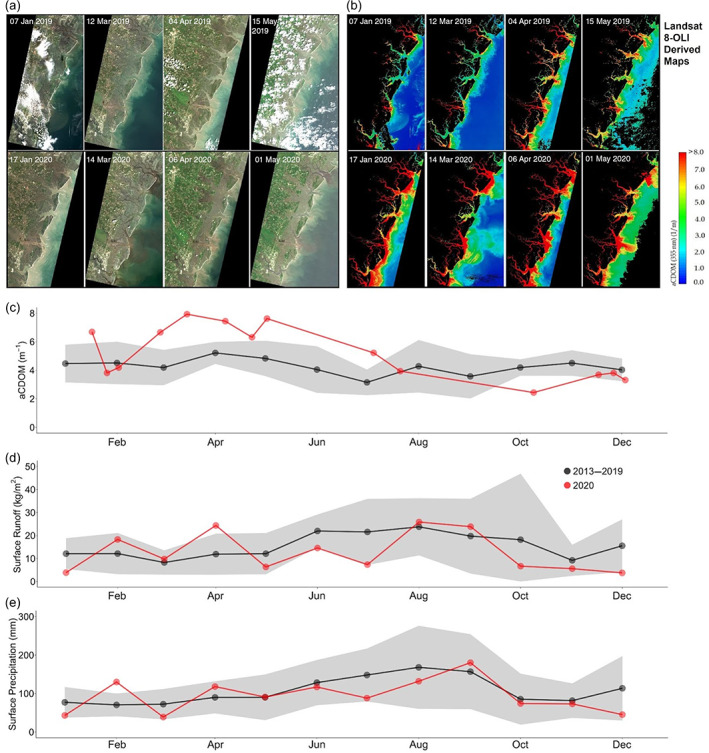
FIGURE 6.

Comparison of (a) monthly true color images and (b) estimates of absorption by colored dissolved organic matter (CDOM [aCDOM]) at 355 nm (m−1) in Georgia coastal waters in 2019 and 2020. Time series of (c) Landsat 8 derived a CDOM for the Georgia Coastal Ecosystems Long Term Ecological Research (LTER) domain showing monthly means for the years 2013–2019 compared to 2020. Time series of (d) area‐averaged monthly means (2013–2019) of surface runoff compared to 2020 and (e) monthly means of surface precipitation (2013–2019) compared to 2020 for coastal Georgia. The surface runoff and precipitation data were derived from NASA's MERRA‐2 long‐term global re‐analysis database (MERRA‐2 Model M2TMNXLND v5.12.4). Data for 2013–2019 are represented as means (black points) and SDs (gray shaded region), and 2020 data are represented as red points. Source: Landsat 8‐OLI. The CDOM model (R 2 = 0.74) used in this study was originally developed for Landsat 5‐TM (Joshi & D'Sa, 2015). However, both Landsat 8‐OLI and Landsat 5‐TM have similar green and red bands (band centers and bandwidths) that were used in the CDOM model, and therefore, we assume the impact of the sensor differences would be minimal in CDOM estimation. Note about uncertainty: The model was developed for Barataria Bay, Louisiana. We have not tuned the model for coastal Georgia because of the lack of in situ data
