Figure 3.

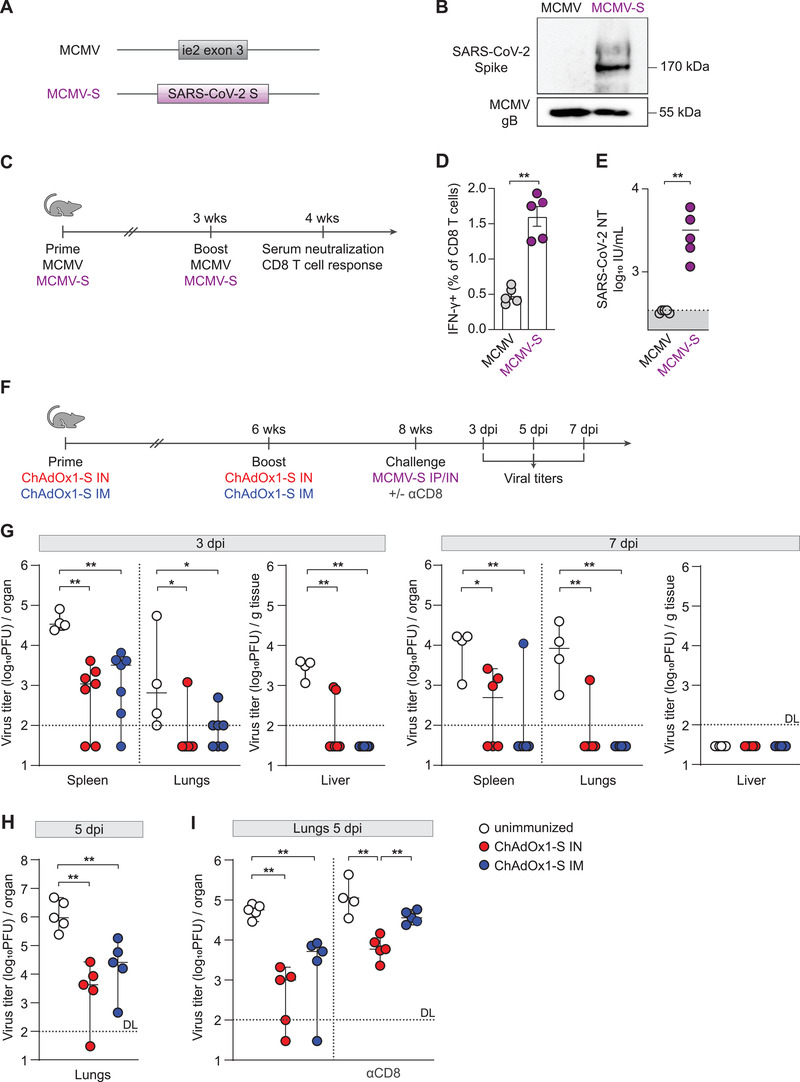
Intranasal immunization with ChAdOx1‐S confers excellent protection from challenge with a heterologous virus expressing SARS‐CoV‐2 S protein. (A) Schematic representation of the recombinant MCMV vector (MCMV‐S). The SARS‐CoV‐2 Spike ORF was inserted in the place of the MCMV ie2. (B) Western blots of purified virus stocks of MCMV‐S and MCMV were performed with an antibody against the SARS CoV‐2 S protein. Protein gB/M55 of MCMV was used as a loading control. (C) BALB/c mice were infected intravenously with MCMV or MCMV‐S (2 × 10⁵ PFU/mouse), and 3 weeks later, mice were boosted. (D) Four weeks after the first immunization, spleen homogenates were restimulated with Spike‐specific peptide KNKCVNFNF (S535‐543). The responding CD8 T cells were identified by intracellular staining for accumulated IFN‐γ. Bars represent group means overlaid with individual data points (n = 5). (E) Neutralization titers were determined by in vitro neutralization assay (all groups n = 5). Dotted lines indicate the median value of IU/mL of unimmunized mice sera. Dots represent individual data points. (F) BALB/c mice were vaccinated via intranasal (IN) or intramuscular (IM) route with ChAdOx1‐S. Six weeks after the first immunization, mice were boosted and 2 weeks later challenged with either intraperitoneal (IP) or intranasal (IN) inoculation of MCMV‐S (2 × 10⁵ PFU/mouse). At different time points, namely at 3 and 7 days after the intraperitoneal (G), or 5 days after the intranasal challenge (H–I), respectively, tissues were harvested, and viral titers were determined in lung, spleen, and liver homogenates (n = 4–7). (I) In some groups, CD8 T cells were depleted systemically by intraperitoneal injection of 500 µg of α‐CD8α antibody 1 day before intranasal MCMV‐S challenge. (G–I) Titers in organs of individual mice are shown (circles); horizontal bars indicate the median values. Dotted lines indicate the detection limit of the assay (DL). Data were analyzed by Mann–Whitney U test (D‐E, G‐I); p values indicate significant differences (*p < 0.05; **p < 0.01). All experiments (B, D, G‐I) have been repeated two to three times. IU: international units.
