
Figure 1.
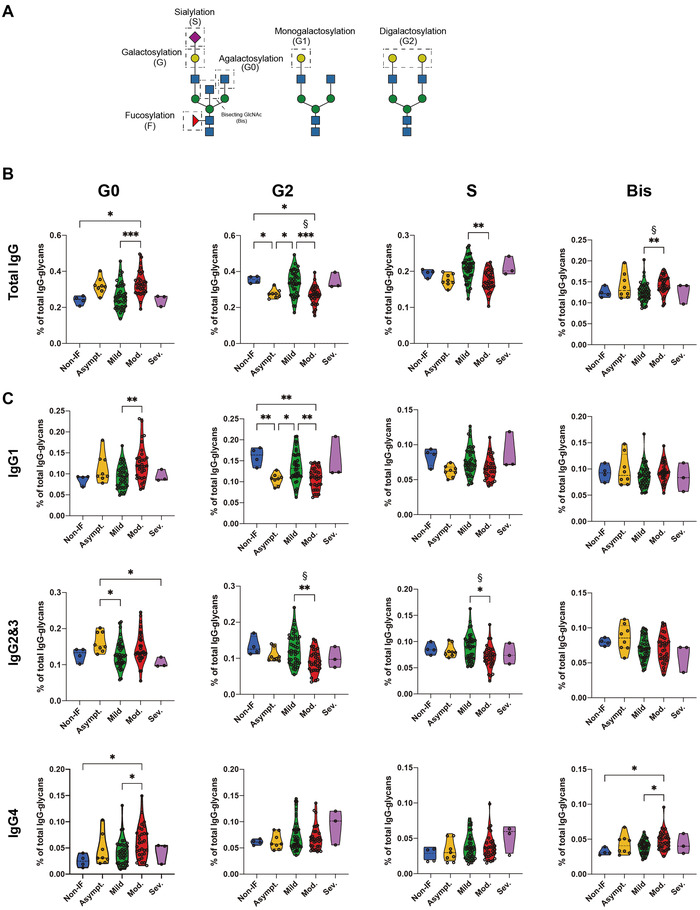
SARS‐CoV‐2 infection drives IgG Fc glycosylation alterations. (A) Schematic representation of analyzed IgG glycan traits. (B) Relative abundance of total IgG Fc agalactosylation (G0), digalatosylation (G2), sialylation (S), and Bis‐GlcNAc (Bis) in different COVID‐19 severities (asymptomatic n = 8, mild n = 40, moderate n = 31, and severe n = 3) and non‐IF individuals (n = 4). (C) Relative abundance of isotype‐specific IgG Fc glycan traits in different COVID‐19 severities and non‐IF individuals. Each data point represents the data from a single patient/subject isolated IgGs in a single LC‐MS analysis (one replicate). Kruskal–Wallis test, *p‐value < 0.05; **p‐value < 0.005; ***p‐value < 0.001. The data were corrected for age effect and linear regression model for age correction was used, § p‐value < 0.05.