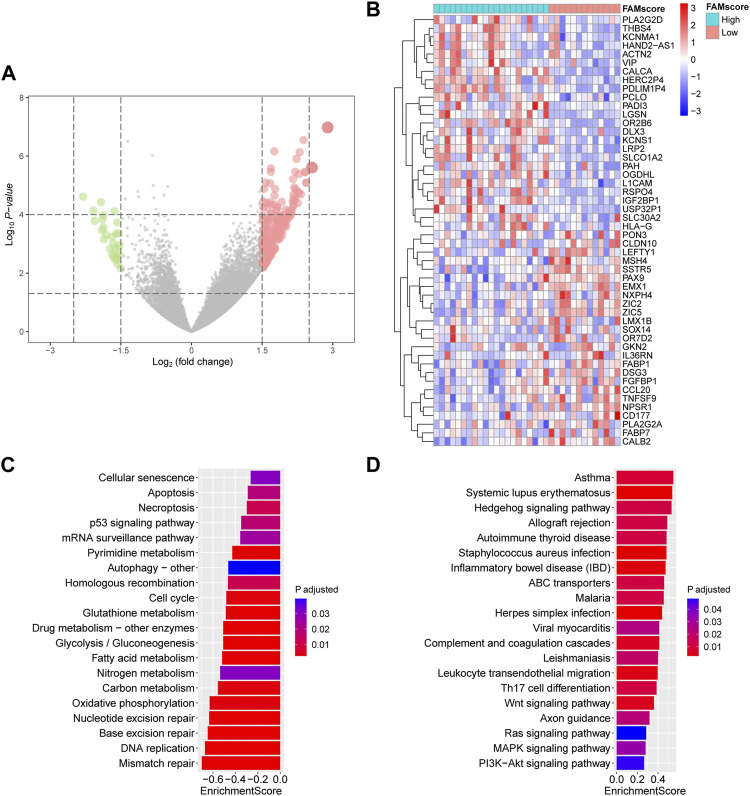
FIGURE 3.
Transcriptome features associated with FAMscore. (A) Volcano plot for differentially expressed genes. (B) Heatmap for top 50 differentially expressed genes between low and high FAMscore subgroups. (C,D) Selected KEGG pathways in GSEA of low (C) and high (D) FAMscore subgroups. KEGG: Kyoto Encyclopedia of Genes and Genomes; GSEA: gene set enrichment analysis.

