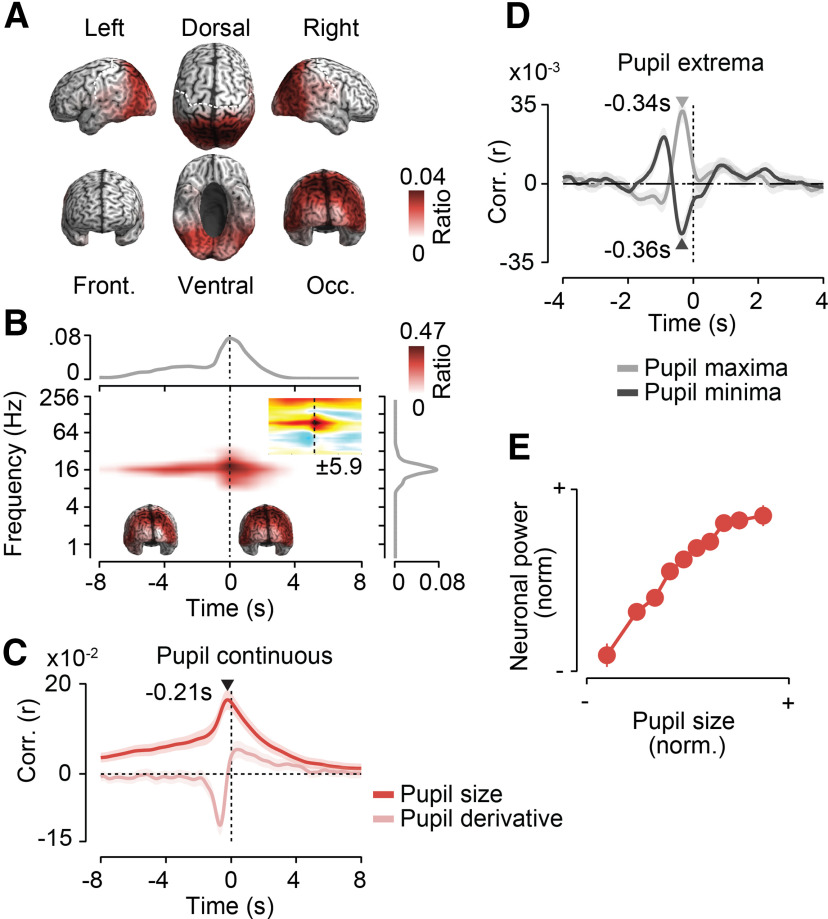
Figure 5.
Posterior 16 Hz activity increases before pupil dilations. Results for a first cluster of positive cross-correlations between power and pupil size are shown. For each cortical location, the in-cluster ratio is the ratio of time points and frequencies that are included in the cluster. A, Cortical distribution of in-cluster ratios averaged across time and frequencies. B, In-cluster ratios averaged across cortical locations (middle), across locations and frequencies (top), and across locations and time (right). In-cluster ratios are the ratios of cortical locations (middle), locations and frequencies (top), and locations and time (right) that are included in the cluster. The small time–frequency inset shows the time–frequency distribution of the cross-correlation of pupil size and cortical population activity within the precentral cluster. Colors indicate average t values across subjects (n = 41; maximum/minimum color scale of t values below the inset; same time–frequency space as the main panel). The inset brains show the cortical distribution of in-cluster ratios for cross-correlations earlier (left inset) and later (right inset) than −1.5 s. C, Temporal cross-correlation of in-cluster power with pupil size and with the temporal derivative of pupil size. D, In-cluster power relative to time points of maximum and minimum pupil size expressed as a correlation coefficient. Arrows indicate the times of statistically compared peak correlations. E, Average normalized pupil size and normalized in-cluster power within each 10% of the normalized pupil size. In-cluster power is shifted 0.21 s forward in time relative to pupil size. All shaded regions and error bars denote the SEM across subjects (n = 41).

