
Figure 6.
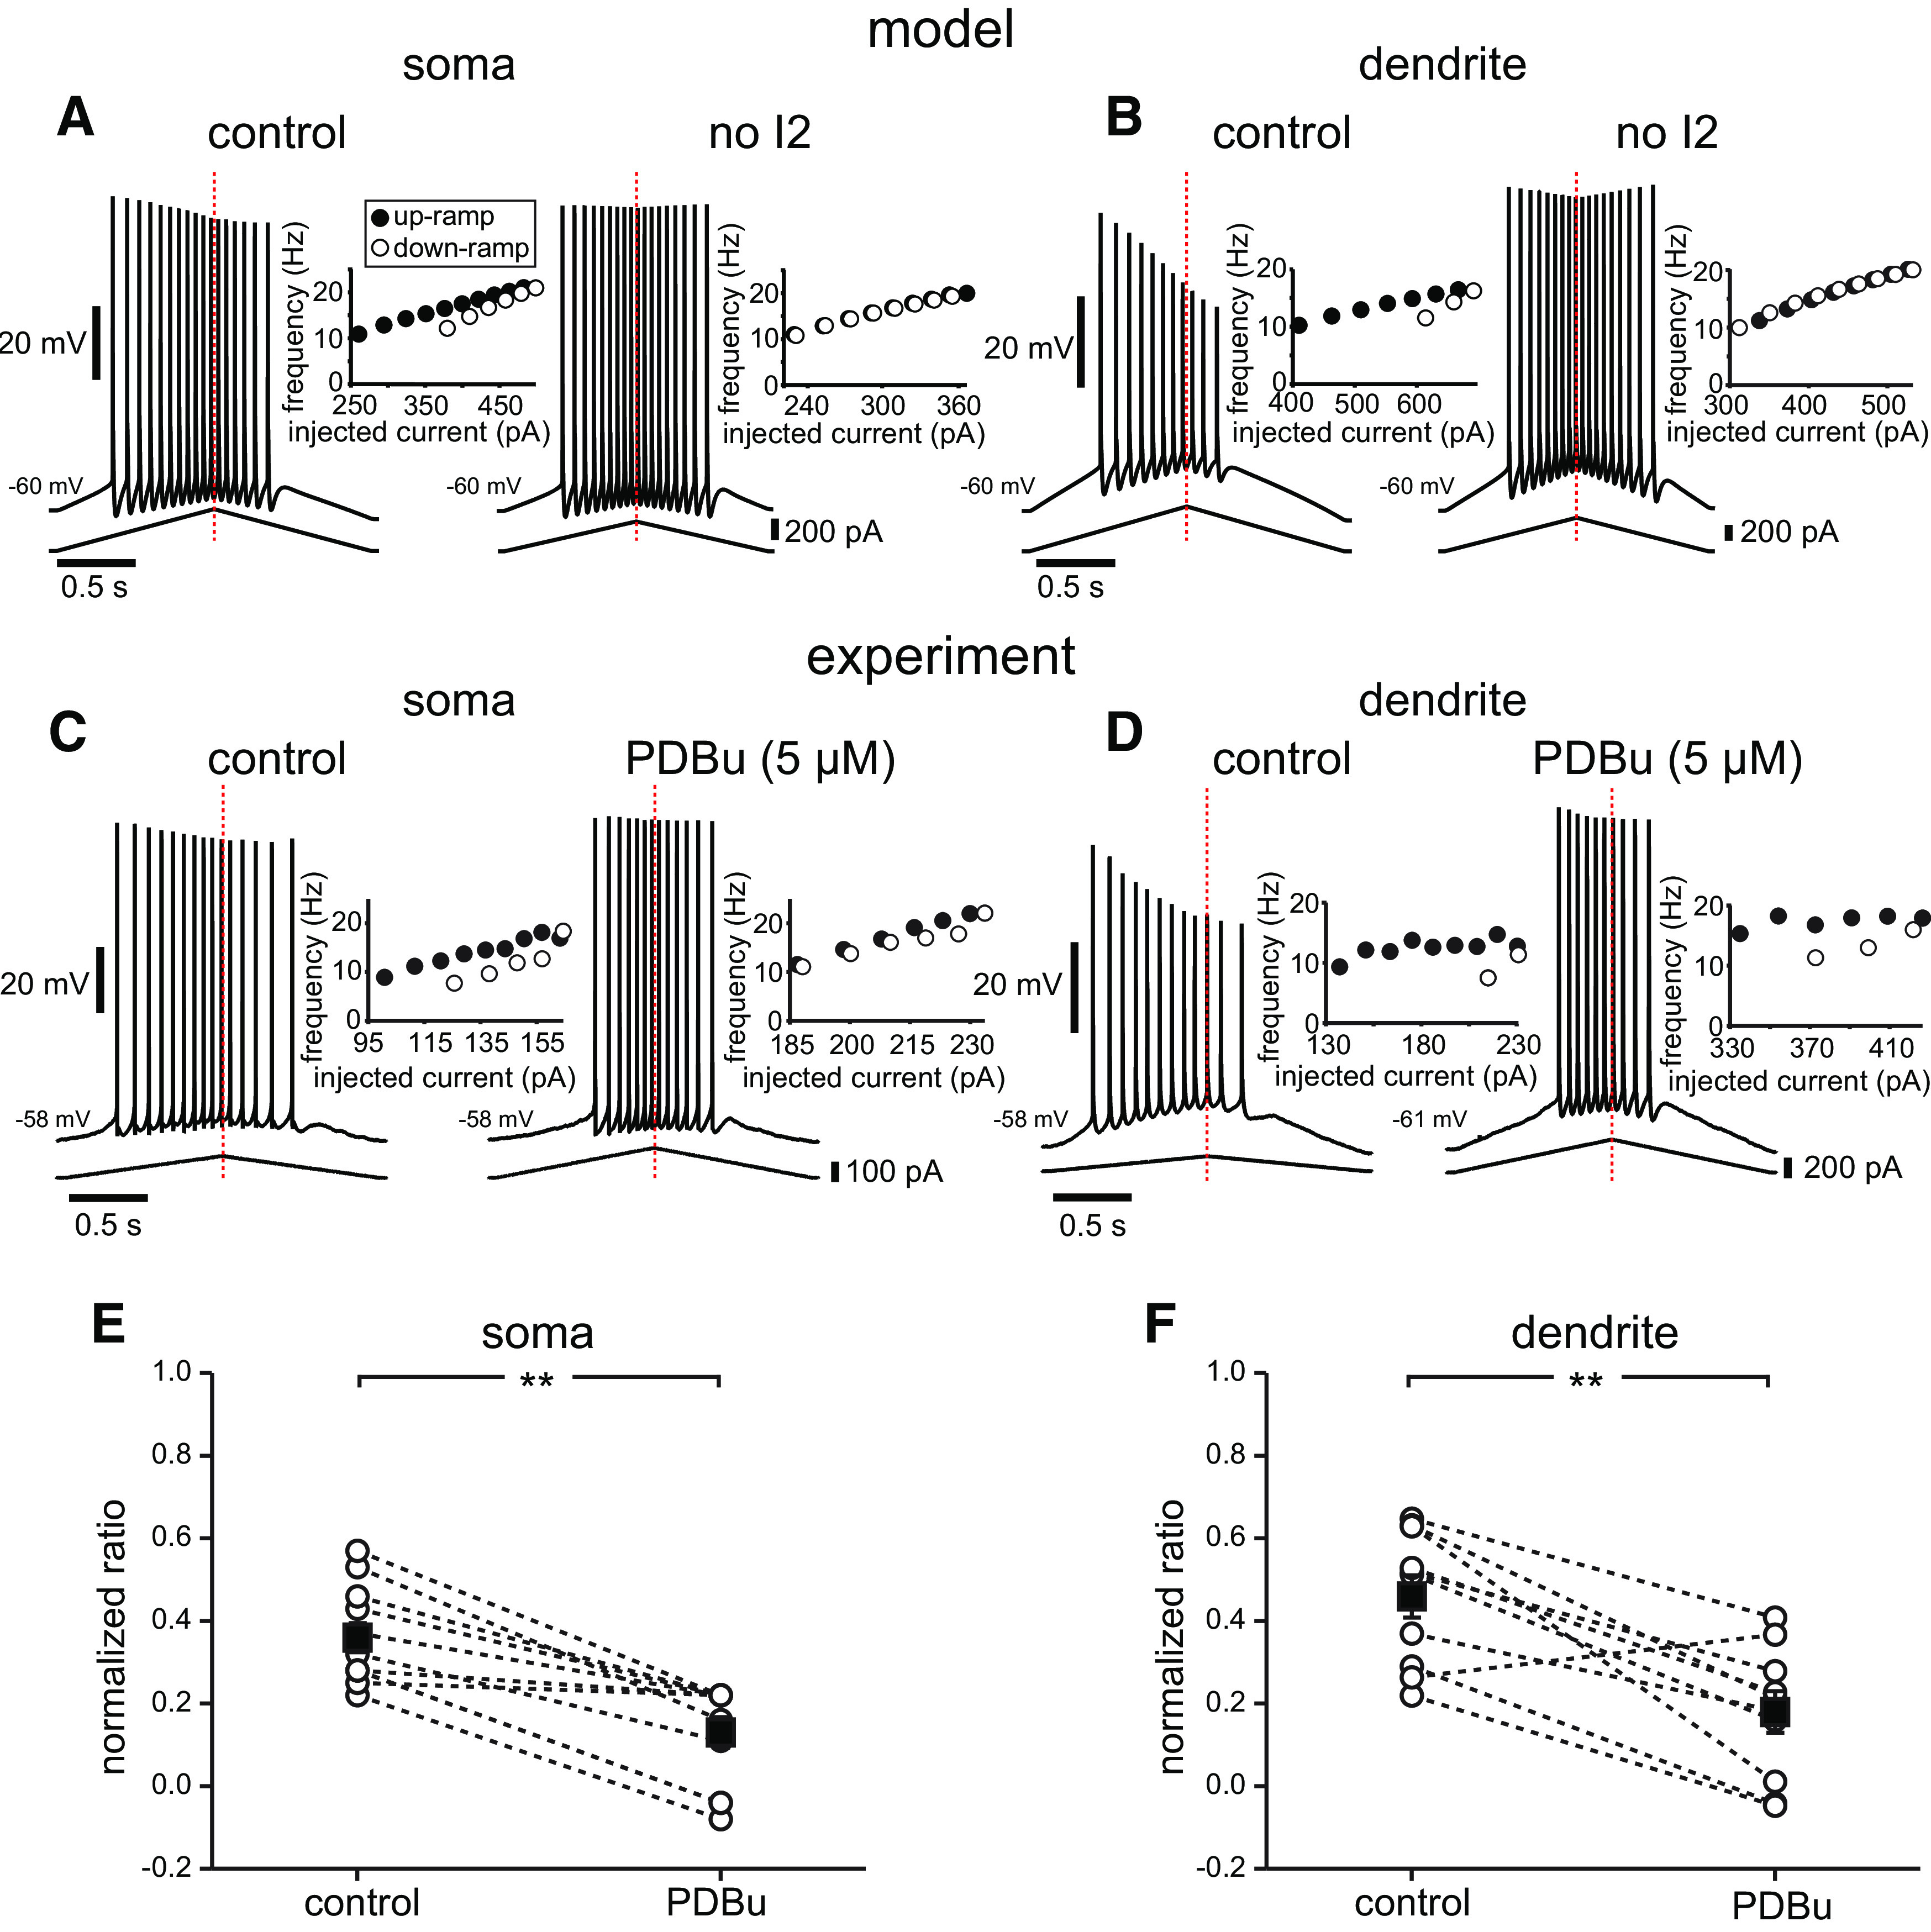
The model predicts and experiments confirm that reducing long-term inactivation reduces adaptation and asymmetry. A, Simulations of somatic current injection in controls and with the I1-to-I2 transition rate set to zero, meaning that there is no occupancy in the long-term inactivated state. The insets show that adaptation and asymmetry are essentially eliminated by this manipulation, producing a linear f/I curve. B, Simulations of dendritic current injection in controls and with the I1-to-I2 transition rate set to zero. Controls in A and B are repeated from Figure 4; stimulus current was injected either in the soma or apical trunk (219 µm from the soma). C, Example experimental traces showing the voltage response to somatic current ramp injection in controls and with 5 μm PDBu. D, Example experimental traces for dendritic current injection before and after the addition of 5 μm PDBu. E, Summary normalized adaptation ratio data for soma (n = 11). F, Summary normalized adaptation ratio data for dendritic ramps (n = 10). Dotted lines connect individual cell averages before and after addition of drug. Black squares with error bars represent group averages ± SEM. **p < 0.001.