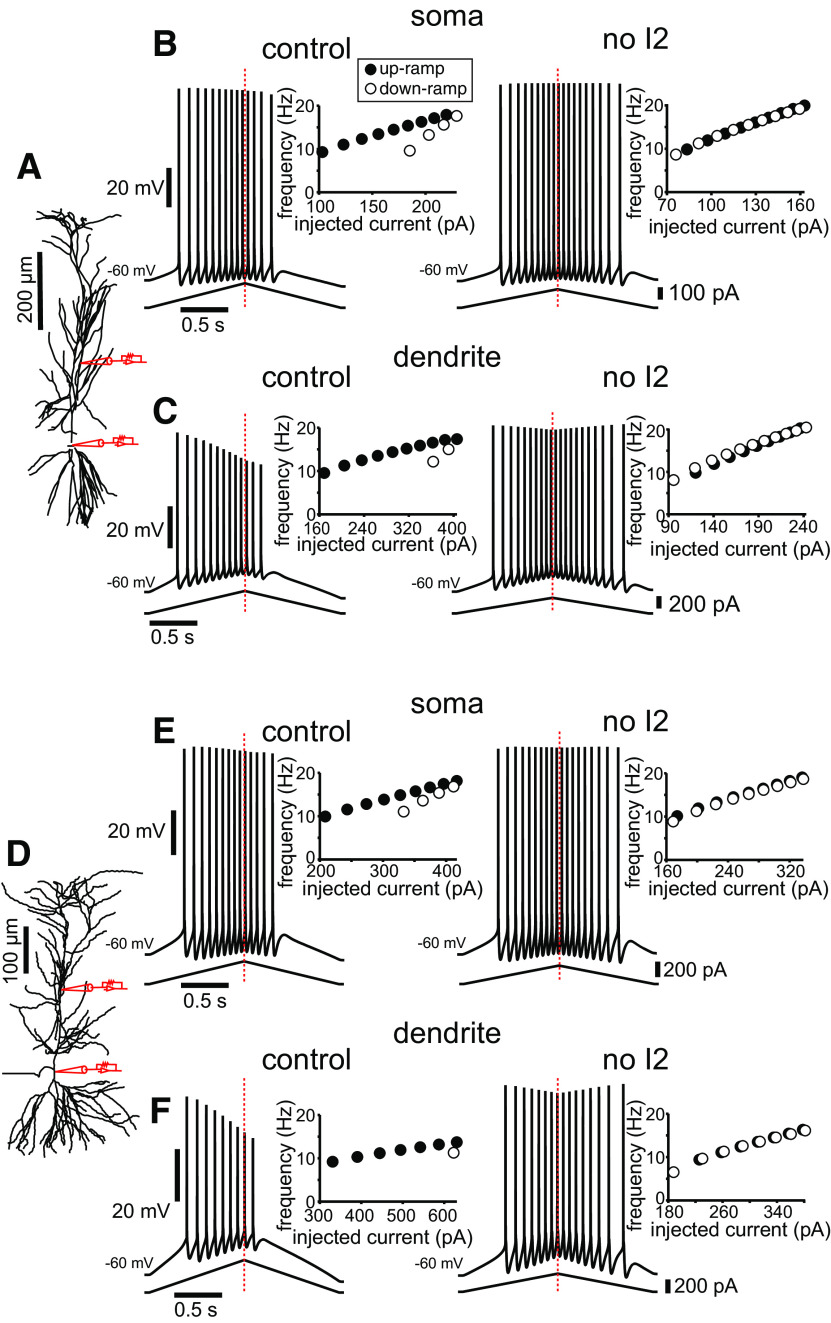
Figure 8.
Model predictions on long-term inactivation can be generalized across different morphologies. A, Morphology (http://neuromorpho.org/neuron_info.jsp?neuron_name=c80761; Ishizuka et al., 1995) as implemented in the simulation package NEURON, showing the location of simulated current injection. The point where the apical dendrite branches into the tuft is at 388 µm from the soma in this case. Stimulus current was injected either in the soma or apical trunk. B, Simulations of somatic current injection in control (left) and with the I1-to-I2 transition rate set to zero (right). C, Simulations of dendritic current injection (at 192 µm from the soma) in control (left) and with the I1-to-I2 transition rate set to zero (right). D–F, Same as above for morphology (http://neuromorpho.org/neuron_info.jsp?neuron_name=pc1a; Megías et al., 2001). The point where the apical dendrite branches into the tuft is at 343 µm from the soma in this case. Stimulus current was injected either in the soma or apical trunk (at 208 µm from the soma). In this case, the percentage of inactivation in the model (Fig. 1D3) was uniformly decreased by 5% to increase firing with dendritic injection; the resulting plot was still in the envelope of the experimental data (Fig. 1D2). The only parameters changed in the Boltzmann equations in Table 1 were the two Rmax values for the I1-to-O transition (A–C: 3e-4 and 1.5e-3; D–F: 2.5e-4 and 1.25e-3). In all cases, the insets show that adaptation and asymmetry are essentially eliminated, producing a linear f/I curve, by setting the I1-to-I2 transition rate to zero.

