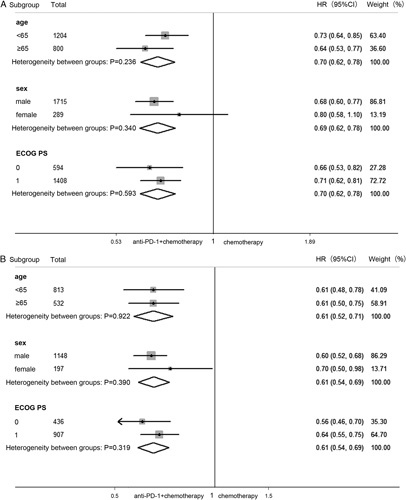
FIGURE 4.

Forest plot of hazard ratio in subgroup analysis by clinical information comparing overall survival (A) and progression-free survival (B) in patients who received PD-1 inhibitor plus chemotherapy versus chemotherapy. CI indicates confidence interval; HR, hazard ratio; ECOG PS, Eastern Cooperative Oncology Group performance status; PD-1, programmed cell death 1.
