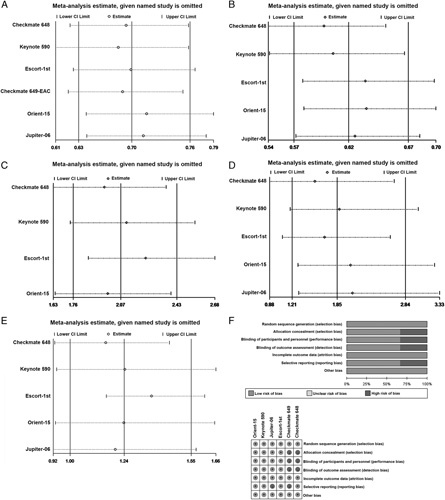
FIGURE 6.

Sensitivity analysis of the hazard ratios of overall survival (A) and progression-free survival (B) and the odds ratio for objective response rate (C), treatment-related adverse events (TRAEs) (D), and grade 3 or higher TRAEs (E). The risk of bias was evaluated by using Review Manager 5.3 (F). CI indicates confidence interval.
