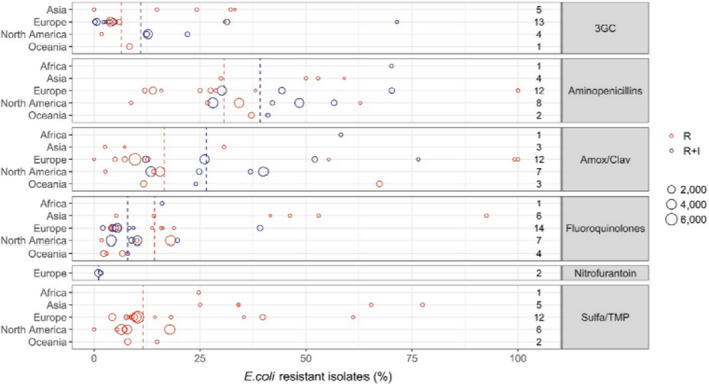
Figure 1.

E. coli resistance data for each included study sorted by continent (obtained from EFSA AHAW Panel (2021a)). The total number of studies by continent and antimicrobial is reported on the right side. Each circle represents one study and the size of each circle reflects how many isolates were included in the study. The colour of a circle illustrates whether the proportion represents resistance only (red circle) or resistance merged with intermediate (blue circle). The dashed lines indicate, for each antibiotic, the weighted arithmetic mean of %R (red dashed line) or %R + I (blue dashed line)
