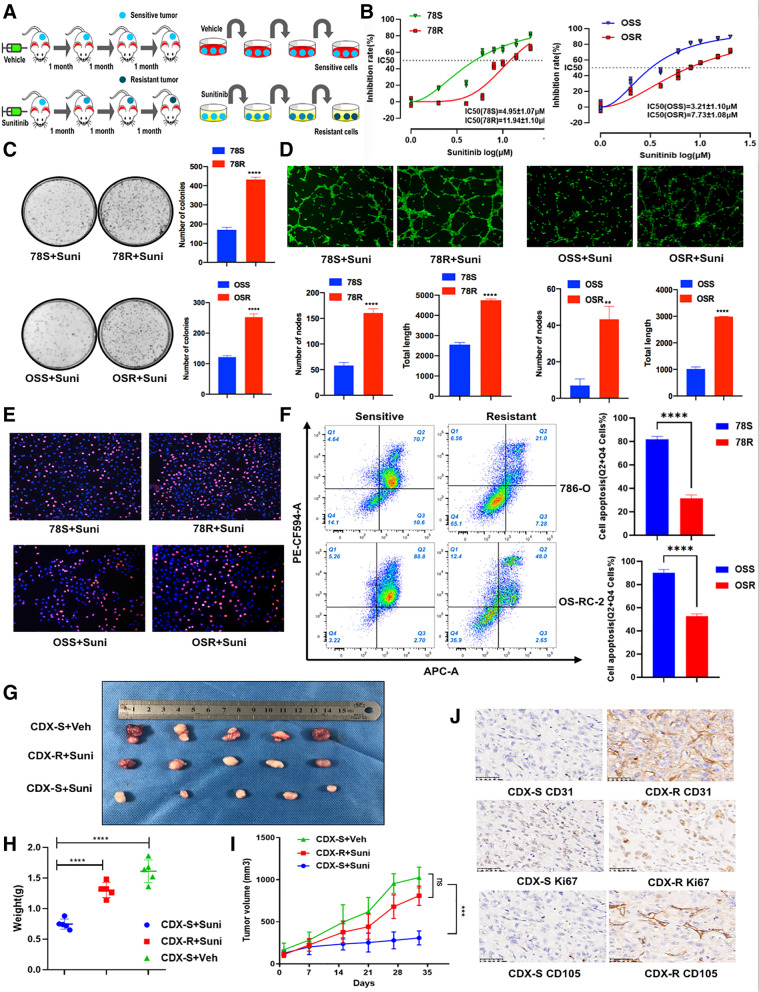
Fig. 1.
Establishment and verification of sunitinib-resistant models. A The graphical representation of sunitinib-resistant models. B CCK8 assay of sunitinib-resistant cell lines and control cell lines with sunitinib treatment at indicated concentrations for 48 h. C Colony formation assay of sunitinib-resistant cell lines and control cell lines with sunitinib treatment (2 uM) in 6-well dish for 3 weeks (n = 3). Representative images (left) and average number of colonies (right) are shown. D Tube formation assay of sunitinib-resistant cell lines and control cell lines in 48-well dish. Representative images (up) and total number of nodes and length (below) are shown. E EdU assay was applied to compare the cell proliferation ability in sunitinib-resistant cell lines and control cell lines with sunitinib treatment (7 uM for 78S/R, 5 uM for OSS/R) (scale bar, 100 μm). F Analysis of apoptosis in 78R, 78S, OSR and OSS cells with sunitinib treatment by flow cytometry (7 uM for 78S/R, 5 uM for OSS/R). G-I Tumor volume, tumor weight and tumor growth curve of CDX-S and CDX-R under sunitinib or vehicle treatment(40 mg/kg/day) for 30 days. J Immunohistochemistry for KI67, CD31 and CD105 comparing CDX-S and control CDX-R. Scale bar, 50 μm. Data are expressed as the mean ± SEM. Statistical analyses used Student’s t-test and Kaplan–Meier survival analysis. p < 0.05 was considered statistically significant. * p < 0.05, ** p < 0.01, *** p < 0.001 and **** p < 0.0001

