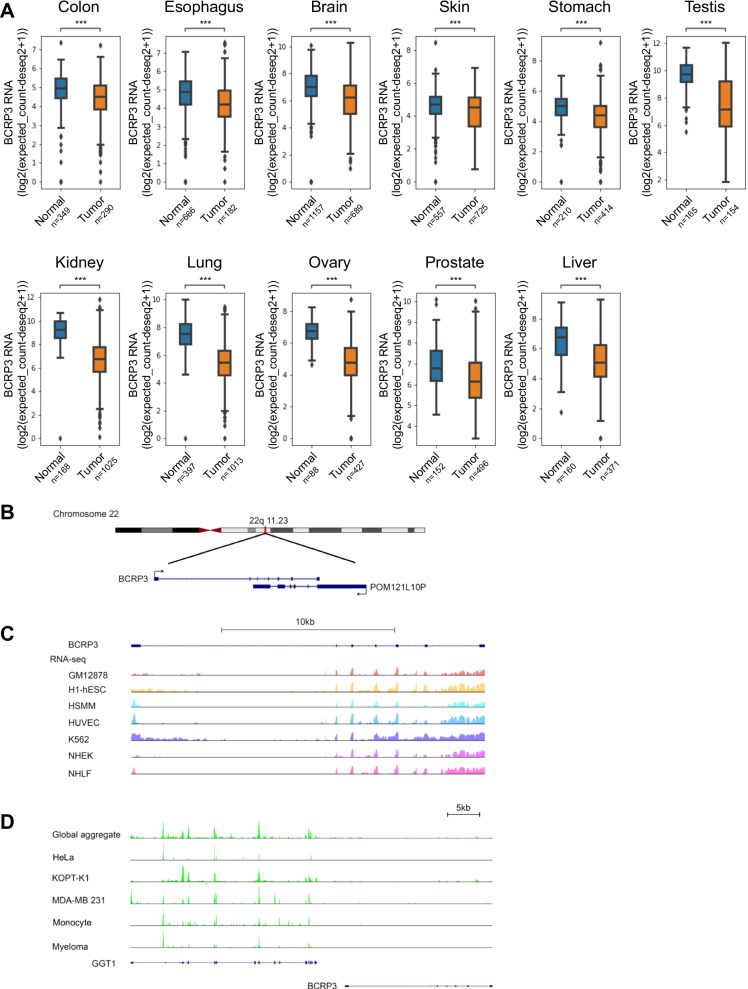
Fig. 1.
Characterization of the BCRP3 gene expression and gene locus. A BCRP3 expression in tumor and normal tissues of indicated cancer types retrieved from TCGA data sets. Whiskers indicate min to max, bounds of box correspond to the fist and third quartiles and the center line represents the median. P values are determined by unpaired t-test, ***P < 0.001. B Genomic loci for lncRNAs BCRP3 and POM121L10P. Exons and the direction of transcription are indicated by filled boxes and arrows, respectively. C BCRP3 RNA-seq data from indicated cells were retrieved from the UCSC database. D Ribo-seq data on BCRP3 and its neighboring protein-coding gene GGT1 from indicated cells were retrieved from the UCSC database

