Fig. 2.
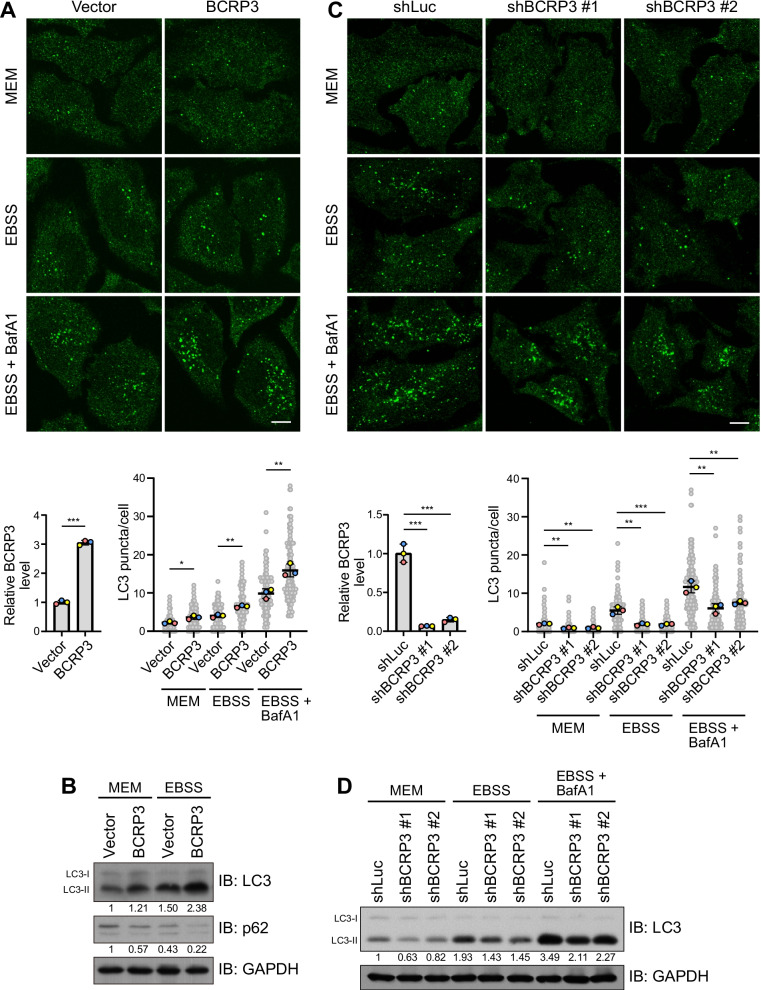
BCRP3 promotes autophagosome formation. A, C Immunofluorescence staining of LC3 in HeLa cells stably expressing vector or BCRP3 (A) or Luc or BCRP3 shRNAs (C) and cultured in full medium (MEM) or EBSS together with or without 200 nM bafilomycin A1 for 2 h. Representative confocal images are shown on the top and quantitative data are on the bottom right. Bar, 10 μm. Relative expression level of BCRP3 was analyzed by qRT-PCR and shown on the bottom left. Data are means ± SD from three independent experiments and 30 cells per group per experiment were counted. P values are determined by unpaired t-test (A) or one-way ANOVA with Tukey’s post hoc test (C), *P < 0.05, **P < 0.01, ***P < 0.001. B, D Western blot analysis of indicated proteins in HeLa cells generated and treated as in (A) or (C), respectively. The levels of LC3-II and p62 are normalized with that of GAPDH and shown on the bottom

