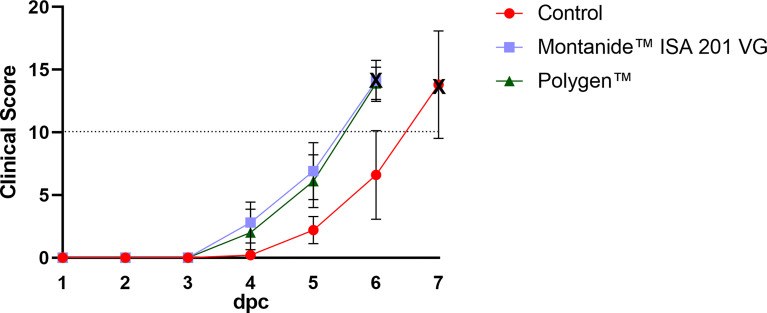
Figure 3.
Mean clinical scores (bars indicate standard deviation) of the vaccinated and control groups after challenge. The control group showed a later onset compared to both vaccinated groups. Dotted line indicates the moderate humane endpoint of 10 score points (indicated as dotted horizontal line). The cross marks the day of euthanasia. dpc, days post challenge.

