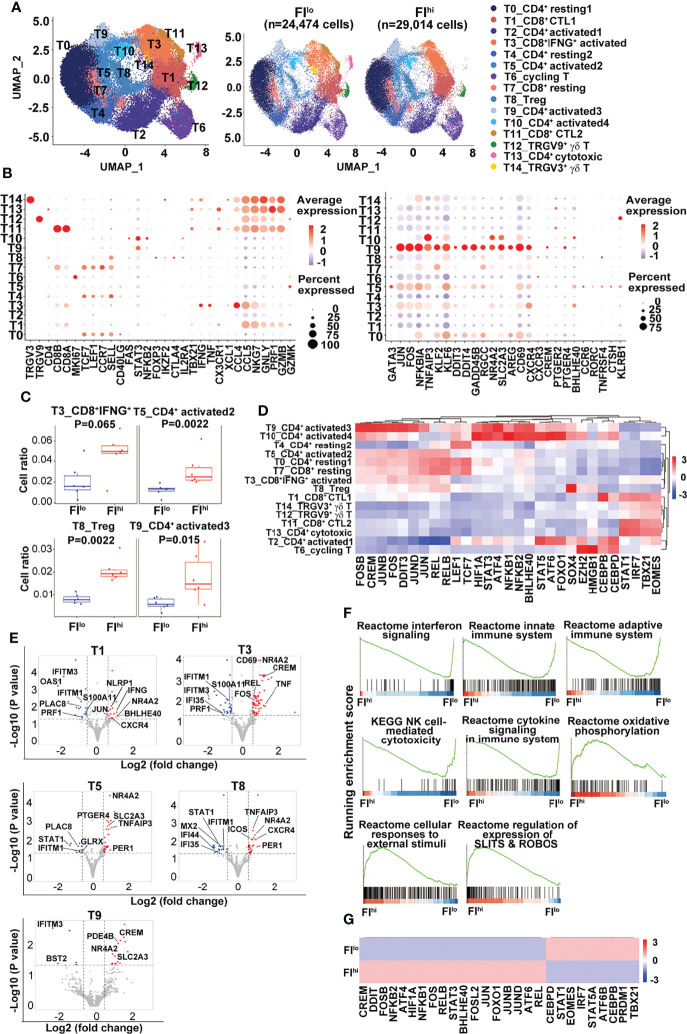
Figure 2.
Increased percentage of activated CD4+ T cells and Treg cells in FIhi patients with severe COVID-19. (A) UMAP visualization of T-cell clusters. (B) Dot plot showing the row-scaled expression of selected signature genes for each cluster. (C) Comparison of the proportions of T-cell clusters between FI lo and FIhi COVID patients. (D) Heatmap of the transcription factors of each cluster, with mean area under the curve (AUC) scores are shown. (E) Volcano plot showing DEGs (p-values < 0.05) in the comparison of each T-cell cluster derived from FIlo and FIhi patients. (F) GSEA analysis of differentially expressed genes (DEGs) in T cells in the comparison of FIlo and FIhi patients with severe COVID-19. (G) Heatmap comparison of the transcription factors in T cells derived from FIlo and FIhi patients.

