Figure 3.
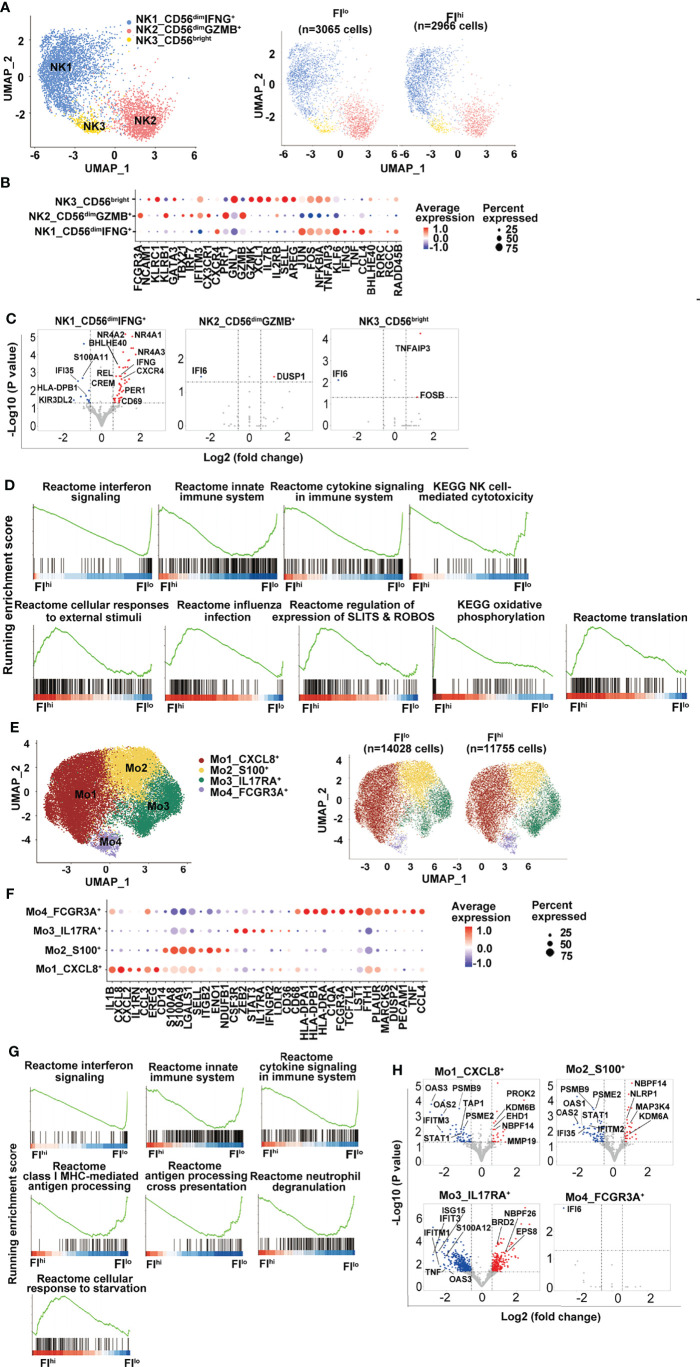
Attenuated global antiviral response in FIhi patients with severe COVID-19. (A) UMAP visualization of NK cell clusters. (B) Heatmap showing the row-scaled expression of selected signature genes for each cluster. (C) Volcano plot showing DEGs (p-values < 0.05) in the comparison of each NK cell cluster derived from FIlo and FIhi patients. The dot lines show 1.5-fold cutoff. (D) GSEA analysis of DEGs in NK cells in the comparison of FIlo and FIhi patients with severe COVID-19. (E) UMAP visualization of monocyte clusters. (F) Heatmap showing the row-scaled expression of selected signature genes for each cluster. (G) GSEA analysis of DEGs in monocytes in the comparison of FIlo and FIhi patients with severe COVID-19. (H) Volcano plot showing DEGs (p-values < 0.05) in the comparison of each monocyte cluster derived from FIlo and FIhi patients. The dot lines show 1.5-fold cutoff.

