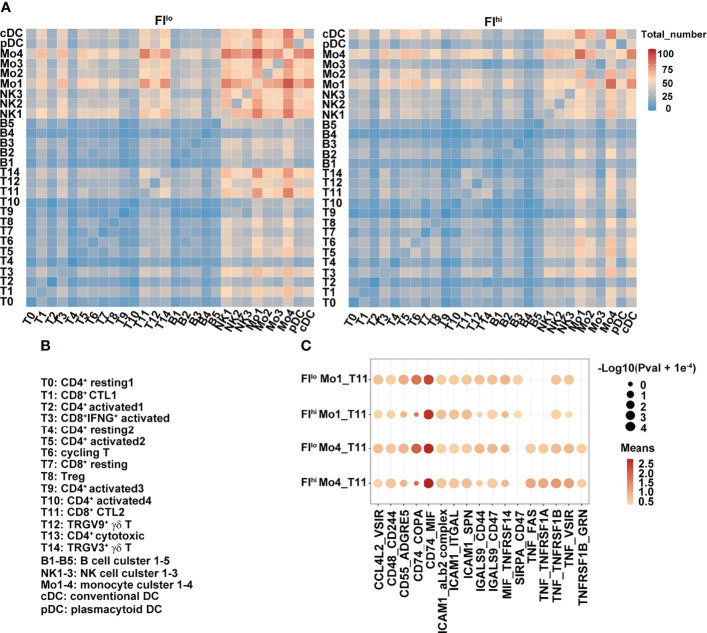
Figure 4.
Weakened interaction between T cells and other cell types in FIhi patients with severe COVID-19. (A) Heatmap shows the number of ligand and receptor pairs co-expressed among various cell types and cell clusters in the patients with severe COVID-19. The results derived from FIlo and FIhi patients were separately shown. (B) Lists of the names of the cell clusters. (C) Bubble plot shows mean expression of ligand and receptor pairs co-expressed between monocyte clusters (Mo1 and Mo4) and CTL cluster T11. The results derived from FIlo and FIhi patients were separately shown.

