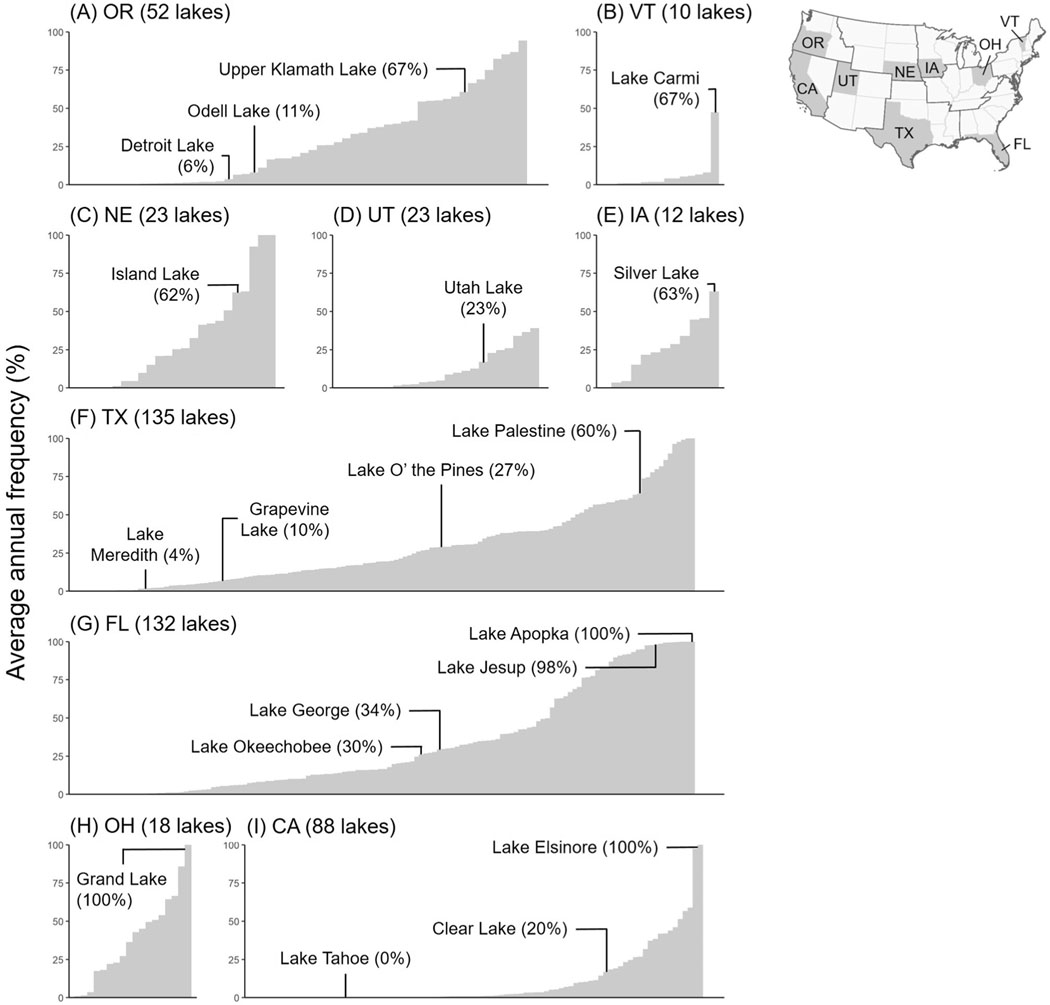
Fig. 5.
Ranked distribution of average annual lake-scale cyanobacterial frequencies for the year 2019 for resolvable lakes in the states of (A) Oregon, (B) Vermont, (C) Nebraska, (D) Utah, (E) Iowa, (F) Texas, (G) Florida, (H) Ohio, and (I) California. For each state, some lakes with documented cases of cyanobacterial blooms either for 2019 or in previous years are labeled. The x-axis is unitless with a range from 1 to the total number of observable lakes in the given state.

