Fig. 1.
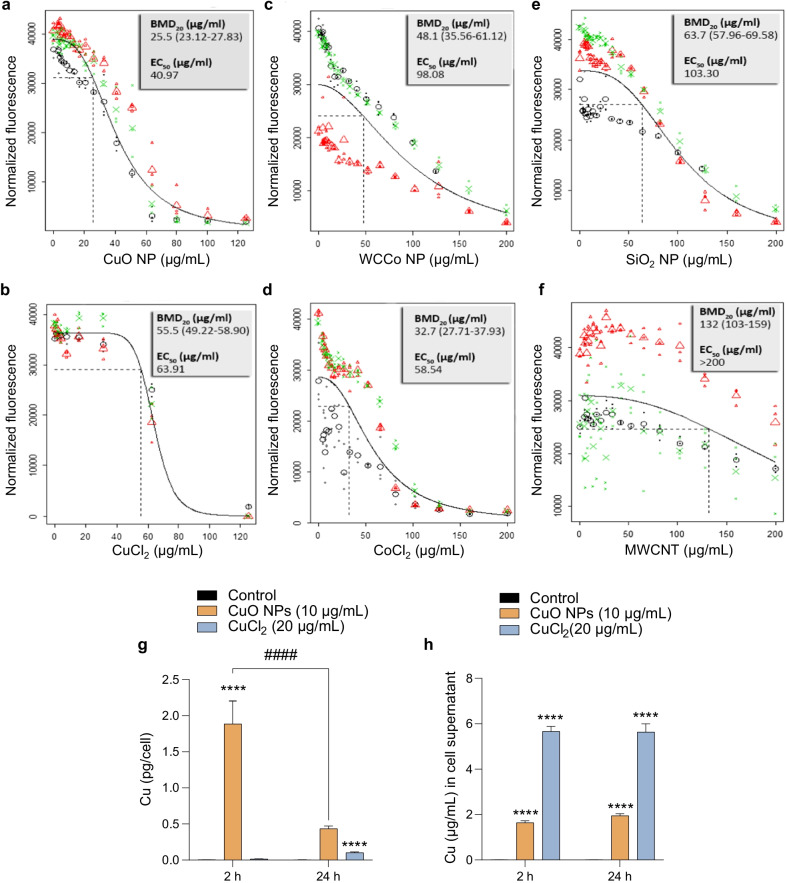
Cytotoxicity screening of a panel of nanomaterials. Cell viability of RAW264.7 cells exposed for 24 h to CuO and WCCo NPs and the corresponding salt (CuCl2 and CoCl2), or SiO2 NPs and multi-walled carbon nanotubes (MWCNTs), was determined using the Alamar Blue assay (metabolic capacity). The benchmark dose (BMD) response for a CuO NPs, b CuCl2, c WCCo NPs, d CoCl2, e SiO2 NPs, and f MWCNTs is reported. The experiment was performed in at least three biological replicates (indicated as red, green, and black symbols). The large symbols in each panel represent geometric mean values of the individual responses, depicted as small symbols. The dashed line in each graph denotes the BMD20 dose estimate. BMD20 and EC50 values are shown in the upper right corner of each panel. g, h Cu content was quantified by ICP-MS after exposure of cells for 2 h and 24 h to CuO NPs and CuCl2. The intracellular concentration of Cu (g), and the concentration of Cu in cell supernatants (h) is reported. The data are shown as mean values ± S.D. (n = 3). ****p < 0.0001; ####p < 0.001

