Fig. 10.
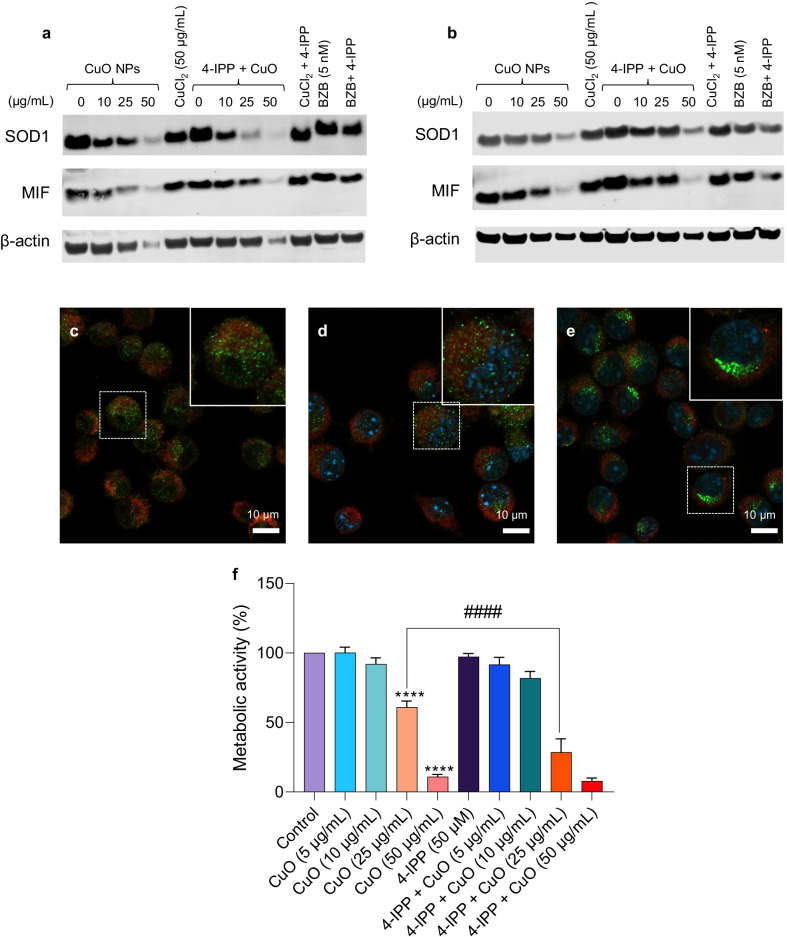
SOD1 expression and role of the SOD1 chaperone, MIF. a, b Western blot analysis of cells exposed for 12 h to CuO NPs at the indicated concentrations in the presence or absence of the MIF inhibitor, 4-IPP (50 µM). Membranes were probed for SOD1 and MIF, and reprobed using antibodies against β-actin as a loading control. Cells were also exposed to the proteasome inhibitor, bortezomib (5 nM). (a) shows the results obtained under non-reducing conditions and (b) shows the results under reducing conditions (10 mM DTT added to the lysis buffer prior to the electrophoresis). Note that at high concentrations of CuO NPs (50 µg/mL) the loading control was also affected (under non-reducing conditions) and therefore the loss of the SOD1 monomer at this concentration cannot be evaluated. In cells exposed to CuO NPs under non-reducing conditions, high molecular weight SOD1 oligomers appeared which disappeared when the samples were run under reducing conditions (data not shown). Similar results were obtained in several experiments performed at 12 h or 24 h. c–f Pharmacological inhibition of the SOD1 chaperone, MIF aggravates CuO NP-induced cell death. RAW264.7 macrophages were exposed for 6 h to medium alone (c), 4-IPP (50 µM) (d), or 4-IPP plus CuO NPs (10 µg/mL) (e) and confocal microscopy was performed to assess the localization of SOD1 (green). Mitochondria and nuclei were identified using MitoTracker™ Red and DAPI (blue), respectively. f Cells were exposed for 24 h to CuO NPs at the indicated concentrations in the presence or absence of the MIF inhibitor, 4-IPP (50 µM) and cell viability (metabolic capacity) was determined using the Alamar blue assay. ****p < 0.0001; ####p < 0.0001

