Fig. 2.
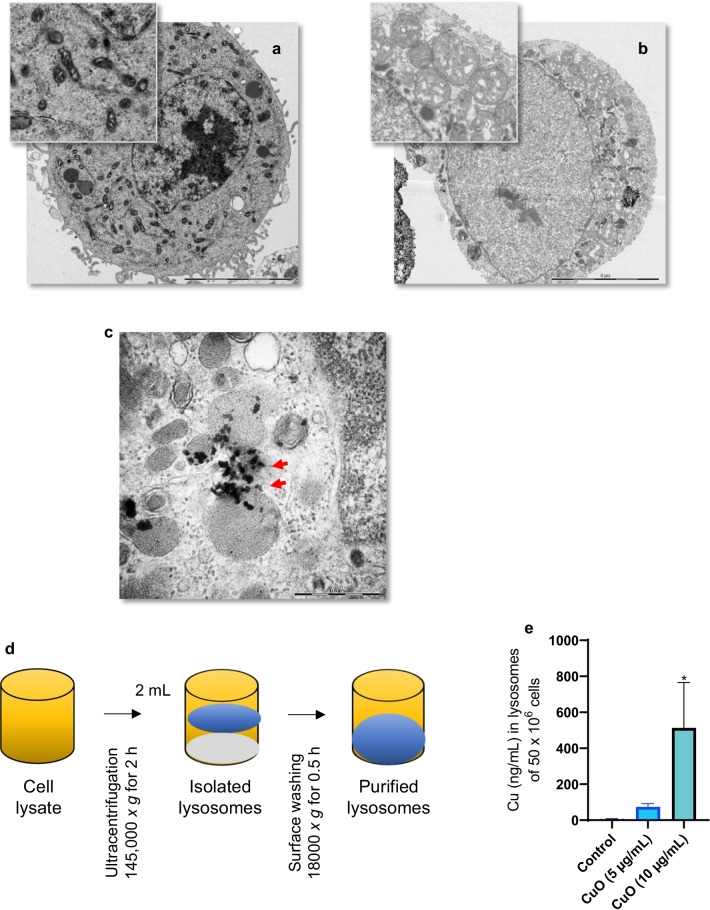
Cellular uptake and lysosomal deposition of CuO NPs. TEM micrographs of control cells (a) and cells exposed for 2 h to CuO NPs (10 µg/mL) (b). The magnified section in (b) shows severely swollen mitochondria in exposed cells compared to control (a). The scale bar in (a) and (b) is 5 µm. c TEM micrograph of cells at 2 h of exposure to CuO NPs shows lysosomes as vesicles displaying characteristic multilamellar whirls while NPs are seen as dark/black specks (red arrows). The scale bar in (c) is 500 nm. d, e Dissolution of CuO NPs in ALF (pH 4.5) at the indicated time points was determined by ICP-MS. d Purification workflow of lysosomes from CuO NP exposed RAW264.7 macrophages. e Concentration of Cu in lysosomes purified from cells after exposure to CuO NPs. Data are mean values ± S.D. (n = 3). *p < 0.05

