Fig. 4.
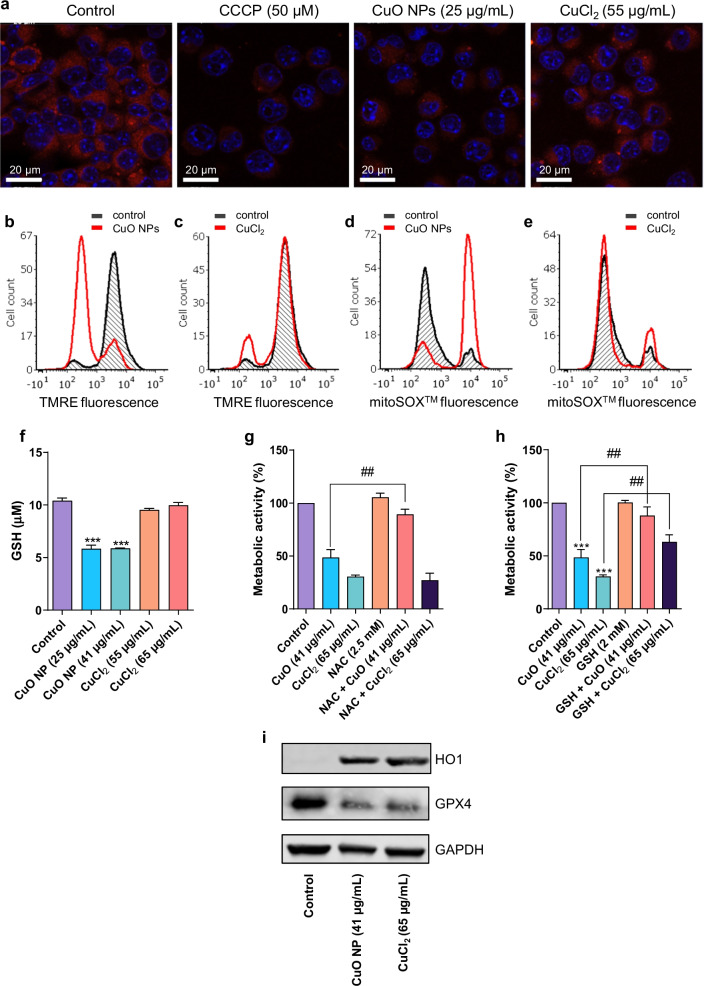
CuO NPs trigger oxidative stress. (a) Mitochondrial membrane potential in RAW264.7 cells was determined by confocal microscopy after 6 h of exposure to CuO NPs and CuCl2 as indicated. The uncoupling agent CCCP was used as a control. Confocal images were captured at × 630 magnification. b, c Mitochondrial membrane potential (TMRE fluorescence) was determined by flow cytometry. Cells were exposed to CuO NPs (25 ug/mL) or CuCl2 (50 ug/mL) as indicated. d, e Mitochondrial superoxide production was determined by flow cytometry using the mitoSOX™ reagent at 6 h of exposure to CuO NPs (25 ug/mL) or CuCl2 (50 ug/mL) as indicated. f Intracellular reduced glutathione (GSH) content after exposure for 12 h to CuO NPs and CuCl2. Supplementation with NAC (g) and GSH (h) protected cells from cell death triggered by the CuO NPs at 24 h. Data shown are mean values ± S.D. (n = 3). ***p < 0.001, (significant difference between control and treatments); ##p < 0.01 (significant difference between treatments). i HO-1 and GPX4 expression monitored by western blot after exposure of cells to CuO NPs and CuCl2 for 24 h, as indicated. GAPDH was used to control for equal loading

