. 2018 Oct 19;8(62):35706–35718. doi: 10.1039/c8ra07441k

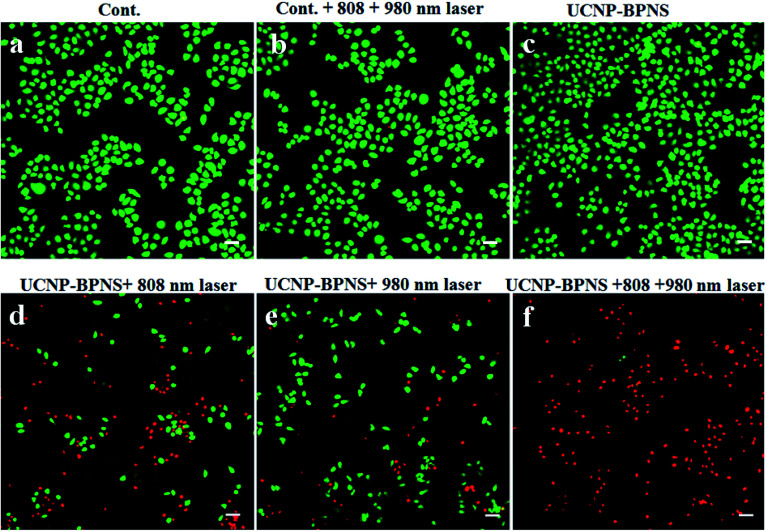
Fig. 7. Fluorescence microscopy images of calcein AM/PI-stained HeLa cells that show control group (without UCNP–BPNS) (a), control group irradiated with both 808 nm (1.5 W cm−2, 30 min: 10 min break after each 10 min irradiation) and 980 nm (0.5 W cm−2, 6 min: 2 min break after every 2 min irradiation) lasers (b); and HeLa cells incubated with 400 μg mL−1 UCNP–BPNS without laser (c), irradiated with 808 nm laser with 1.5 W cm−2 for 30 min (d), irradiated with 980 nm laser with 0.5 W cm−2 for 6 min (e), and irradiated with both 808 and 980 nm lasers (f). Green represents live cells, red represents dead cells. There were 10 min break for every 10 min irradiation of 808 nm laser (the total irradiation time is 30 min), and 2 min break for every 2 min irradiation of 980 nm laser (the total irradiation time is 6 min). Scale bar: 40 μm.

Fig. 7