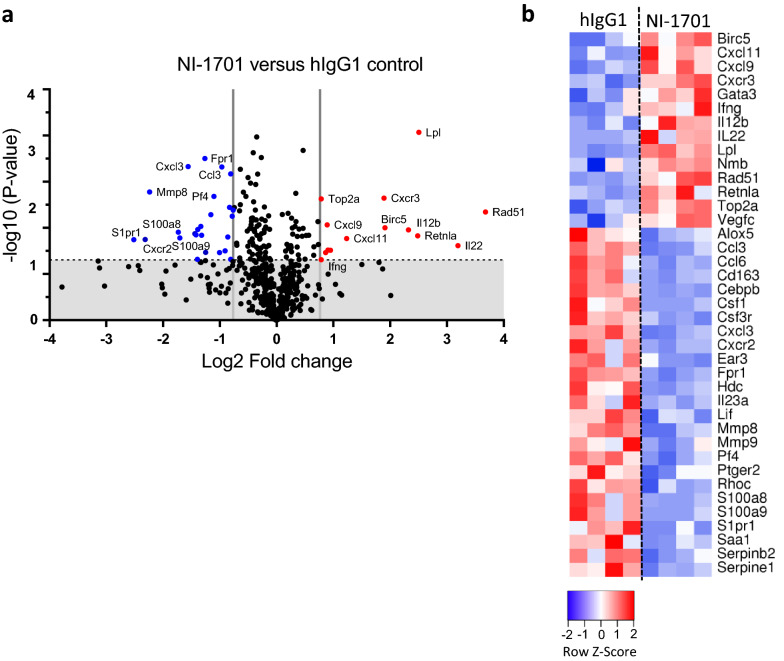
Fig. 2.
Targeted transcriptomic analysis of tumor-infiltrating mouse leukocytes reveals upregulation of proinflammatory cytokine and chemokine genes upon NI-1701 treatment. Mouse CD45+ tumor-infiltrating leukocytes were sorted from tumors 14 days after treatment initiation with NI-1701 or hIgG1 control and submitted to Nanostring transcriptomic analysis using the mouse Myeloid Innate Immunity panel (n = 4 mice per group) a Volcano plot of differentially expressed genes in tumor-infiltrating leukocytes between hIgG1 versus NI-1701. Vertical grey lines correspond to absolute log2 fold change > 0.76 (i.e., fold-change > 1.7) and horizontal dot line correspond to a p value of p = 0.05. Grey zone corresponds to statistically non-significant changes and red and blue dots to significantly upregulated and downregulated genes, respectively. b Heatmap depicting row z scores of normalized mRNA count of significantly up-regulated and down-regulated genes with fold change > 1.7

