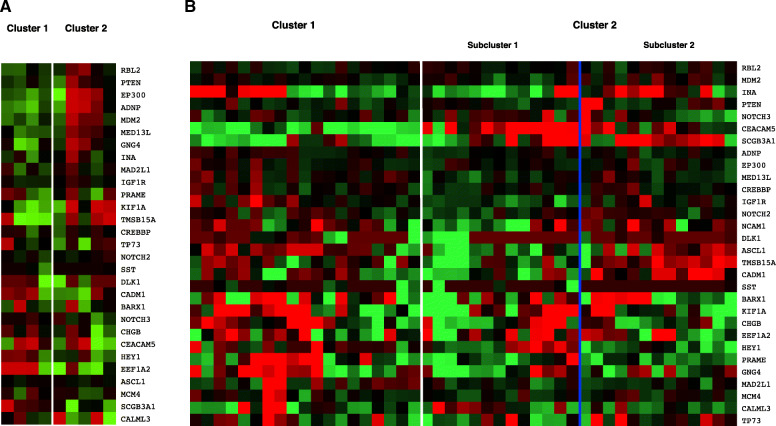
Fig. 3.
Hierarchical clustering using differentially expressed genes. Red indicates decreased expression, while green indicates heightened expression. A Hierarchical clustering of unpaired basaloid squamous cell carcinoma samples distinguishes tumors based on immunohistochemical NE status. Cluster 1 is enriched for NE negative (by IHC) samples (0/4), while Cluster 2 is enriched in NE positive tumors (4/5) (p = 0.048). B Hierarchical clustering of TCGA samples distinguished cases based on tumor type. Cluster 1 is enriched with non-basaloid squamous cell carcinomas (2/19 are basaloid type), while Cluster 2 is enriched with basaloid squamous cell carcinomas (13/26 are basaloid type) (p = 0.0094). A subset of cases from Cluster 2 (Sub-cluster 1) demonstrate higher expression of NOTCH pathway genes including DLK1 (log2 FC = 2.8), ASCL1 (log2 FC = 1.8), CHGB (log2 FC = 1.0) and NCAM1 (log2 FC = 2.9)

