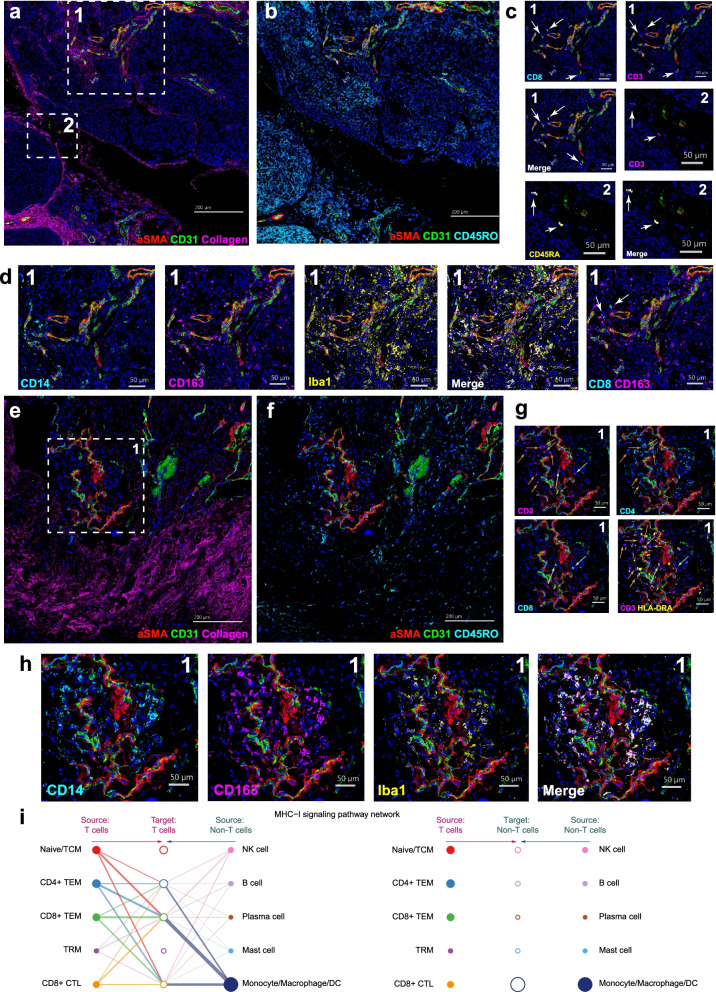
Fig. 4.
Imaging mass cytometry of a human dura sample reveals intricate spatial relationships among immune, endothelial, and mesenchymal cell types. A, B Imaging mass cytometry of human dura sample DURA02 labeled with markers specified and specific regions of interest (ROIs) highlighted by dashed white boxes. C, D Relative position of each image is denoted by marked number in the top left or right corner. Markers are specified and color coded. White arrows label cells of interest. E, F Imaging mass cytometry of human dura sample DURA05 with markers specified and the specific region of interest (ROI) highlighted by a dashed white box. G, H Relative position of each image is denoted by marked number at the top right corner. Markers are specified and color coded. Green arrows represent CD8+ T cells and orange arrows represent CD4+ T cells. I Hierarchical plot showing the inferred network for MHC-I signaling for immune cells from Fig. 2A. The left and right portions of the plot show autocrine and paracrine signaling to T cells and remaining immune cells, respectively. Solid circles represent the source of MHC class I ligands and open circles represent the target of said MHC class I ligands. Circle sizes are proportional to the number of cells and width of connecting lines indicate the communication probability of said interaction

