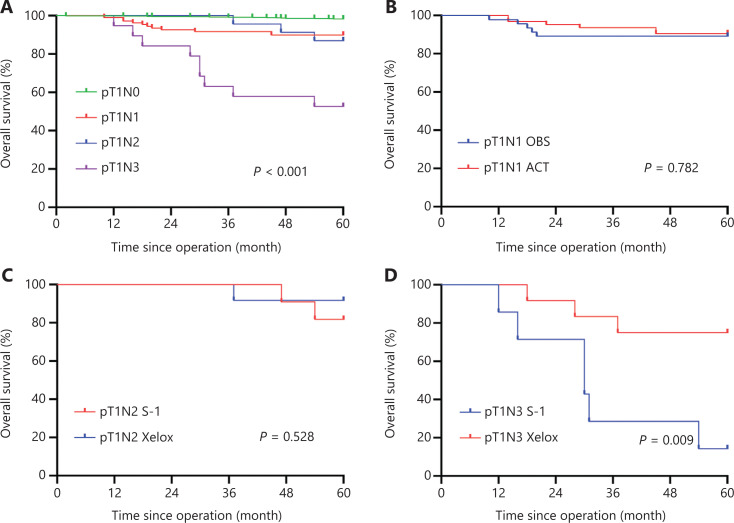
Figure 1.
The 5-year overall survival (OS) for pT1 gastric cancer (GC) patients. (A) Kaplan-Meier curves showing the 5-year OS of pT1N0, pT1N1, pT1N2, and pT1N3 GC patients. (B) Kaplan-Meier curves showing the 5-year OS of pT1N1 GC patients in the ACT and OBS groups. (C) Kaplan-Meier curves showing the 5-year OS of pT1N2 GC patients receiving S-1 and patients receiving Xelox. (D) Kaplan-Meier curves showing the 5-year OS of pT1N3 GC patients receiving S-1 and patients receiving Xelox. ACT, adjuvant chemotherapy; OBS, observation.

