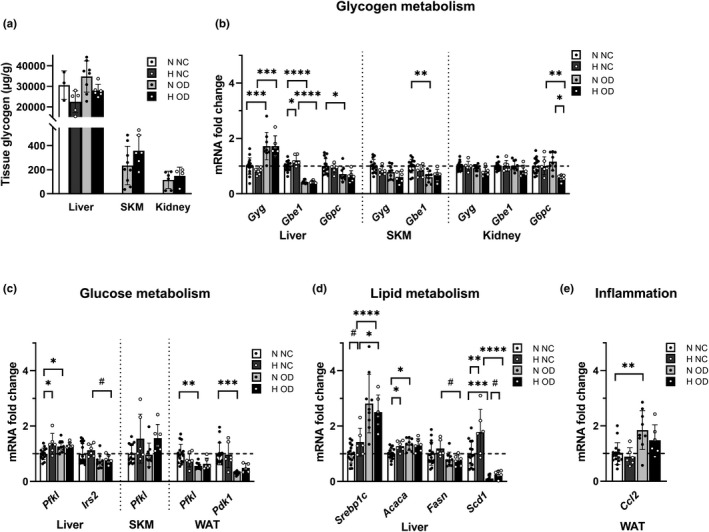
FIGURE 5.

Analysis of maternal tissue glycogen levels and transcript levels of genes involved in glycogen, glucose and lipid metabolism and inflammation. Mice were fed either normal chow (NC) or an obesogenic diet (OD) to induce insulin resistance. During gestation they were housed either in normoxic (N, O2 = 21%) or hypoxic (H, O2 = 15%) conditions. The parameters were measured at E17.5. (a) Maternal liver glycogen (N NC n = 3, H NC n = 5, N OD n = 8, H OD n = 6), maternal skeletal muscle glycogen (N OD n = 9, H OD n = 6), maternal kidney glycogen (N OD n = 9, H OD n = 9). (b) Transcript levels of glycogen metabolism genes in liver, skeletal muscle and kidney. (c) Transcript levels of glucose metabolism genes in liver, skeletal muscle and gonadal WAT. (d) Transcript levels of lipid metabolism genes in liver. (e) Transcript level of inflammation genes in gonadal WAT at E17.5. (N NC n = 16, H NC n = 6, N OD n = 9, H OD n = 6). Gyg, glycogenin;, Gbe1, glycogen branching enzyme 1; G6pc, Glucose‐6‐phosphatase; Pfkl, phosphofructokinase L; Irs2, insulin receptor substrate 2; Pdk1, pyruvate dehydrogenase kinase 1; Srebpc1c, sterol regulatory element binding protein 1c; Acaca, acetyl‐CoA carboxylase alpha; Fasn, fatty acid synthase; Scd1, stearoyl‐CoA desaturase‐1; Ccl2, chemokine (C‐C motif) ligand 2. All data are means ± SD. Two‐way ANOVA *p < 0.05, **p < 0.01, ***p < 0.001, ****p < 0.0001. Student’s t‐test #p < 0.05
