FIGURE 6.

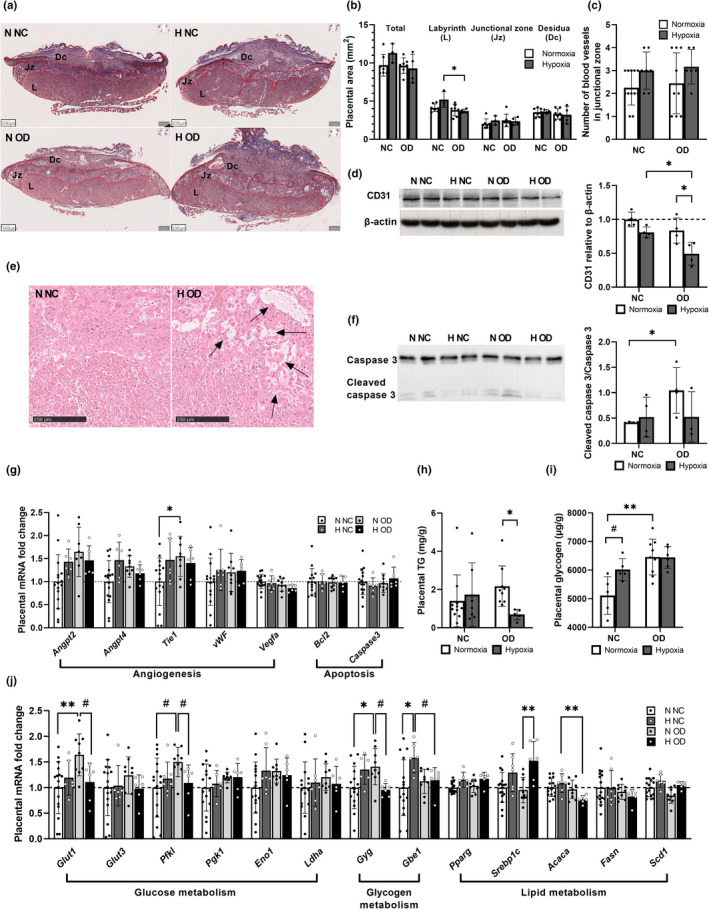
Hypoxia attenuated the placental outcome during end‐pregnancy. Mice were fed either normal chow (NC) or an obesogenic diet (OD) to induce insulin resistance. During gestation they were housed either in normoxic (N, O2 = 21%) or hypoxic (H, O2 = 15%) conditions. The parameters were measured at E17.5. (a) Overview of placental histology stained by Masson’s Trichrome, scale bars 500 µm. L = labyrinth zone, Jz = junctional zone, Dc = decidual layer. (b) Quantification of placental layer area (N NC n = 7, H NC n = 7, N OD n = 3, H OD n = 4). (c) Quantification of the number of blood vessel cross‐sections in the junctional zone (N NC n = 12, H NC n = 7, N OD n = 9, H OD n = 6). (d) Western blot and quantification of CD31 in placenta (N NC n = 4, H NC n = 4, N OD n = 4, H OD n = 4). (e) A close‐up of the junctional zone histology showing necrotic areas with arrows, scale bar 250 µm. (f) Western blot and quantification of cleaved caspase 3 in placenta (N NC n = 4, H NC n = 3, N OD n = 4, H OD n = 4). (g) Placental mRNA levels of angiogenesis and apoptosis related genes (N NC n = 16, H NC n = 7, N OD n = 9, H OD n = 6). (h) Placental triglyceride (TG) content N NC n = 11, H NC n = 9, N OD n = 7, H OD n = 5). (i) Placental glycogen at E17.5 (N NC n = 5, H NC n = 5, N OD =9, H OD n = 6). (j) Placental mRNA levels of glucose, glycogen and lipid metabolism related genes (N NC n = 16, H NC n = 7, N OD n = 9, H OD n = 6). Angpt2, angiopoietin 2; Angpt4, angiopoietin 4; Tie1, tyrosine kinase with immunoglobulin‐like and EGF‐like domains 1; vWF, vonWillebrand factor; Vegfa, vascular endothelial growth factor a; Bcl2, b‐cell lymphoma 2; Glut1, glucose transporter 1; Glut3, glucose transporter 3; Pfkl, phosphofructokinase L; Pgk1, phosphoglycerate kinase 1; Eno1, enolase 1; Ldha, lactate dehydrogenase a; Gyg, glycogenin; Gbe1, glycogen branching enzyme 1; Pparg, peroxisome proliferator‐activated receptor gamma; Srebpc1c, sterol regulatory element binding protein 1c; Acaca, acetyl‐CoA carboxylase alpha; Fasn, fatty acid synthase; Scd1, stearoyl‐CoA desaturase‐1. All data are means ± SD. Two‐way ANOVA *p < 0.05, **p < 0.01, ***p < 0.001, ****p < 0.0001. Student’s t‐test #p < 0.05, ##p < 0.01
