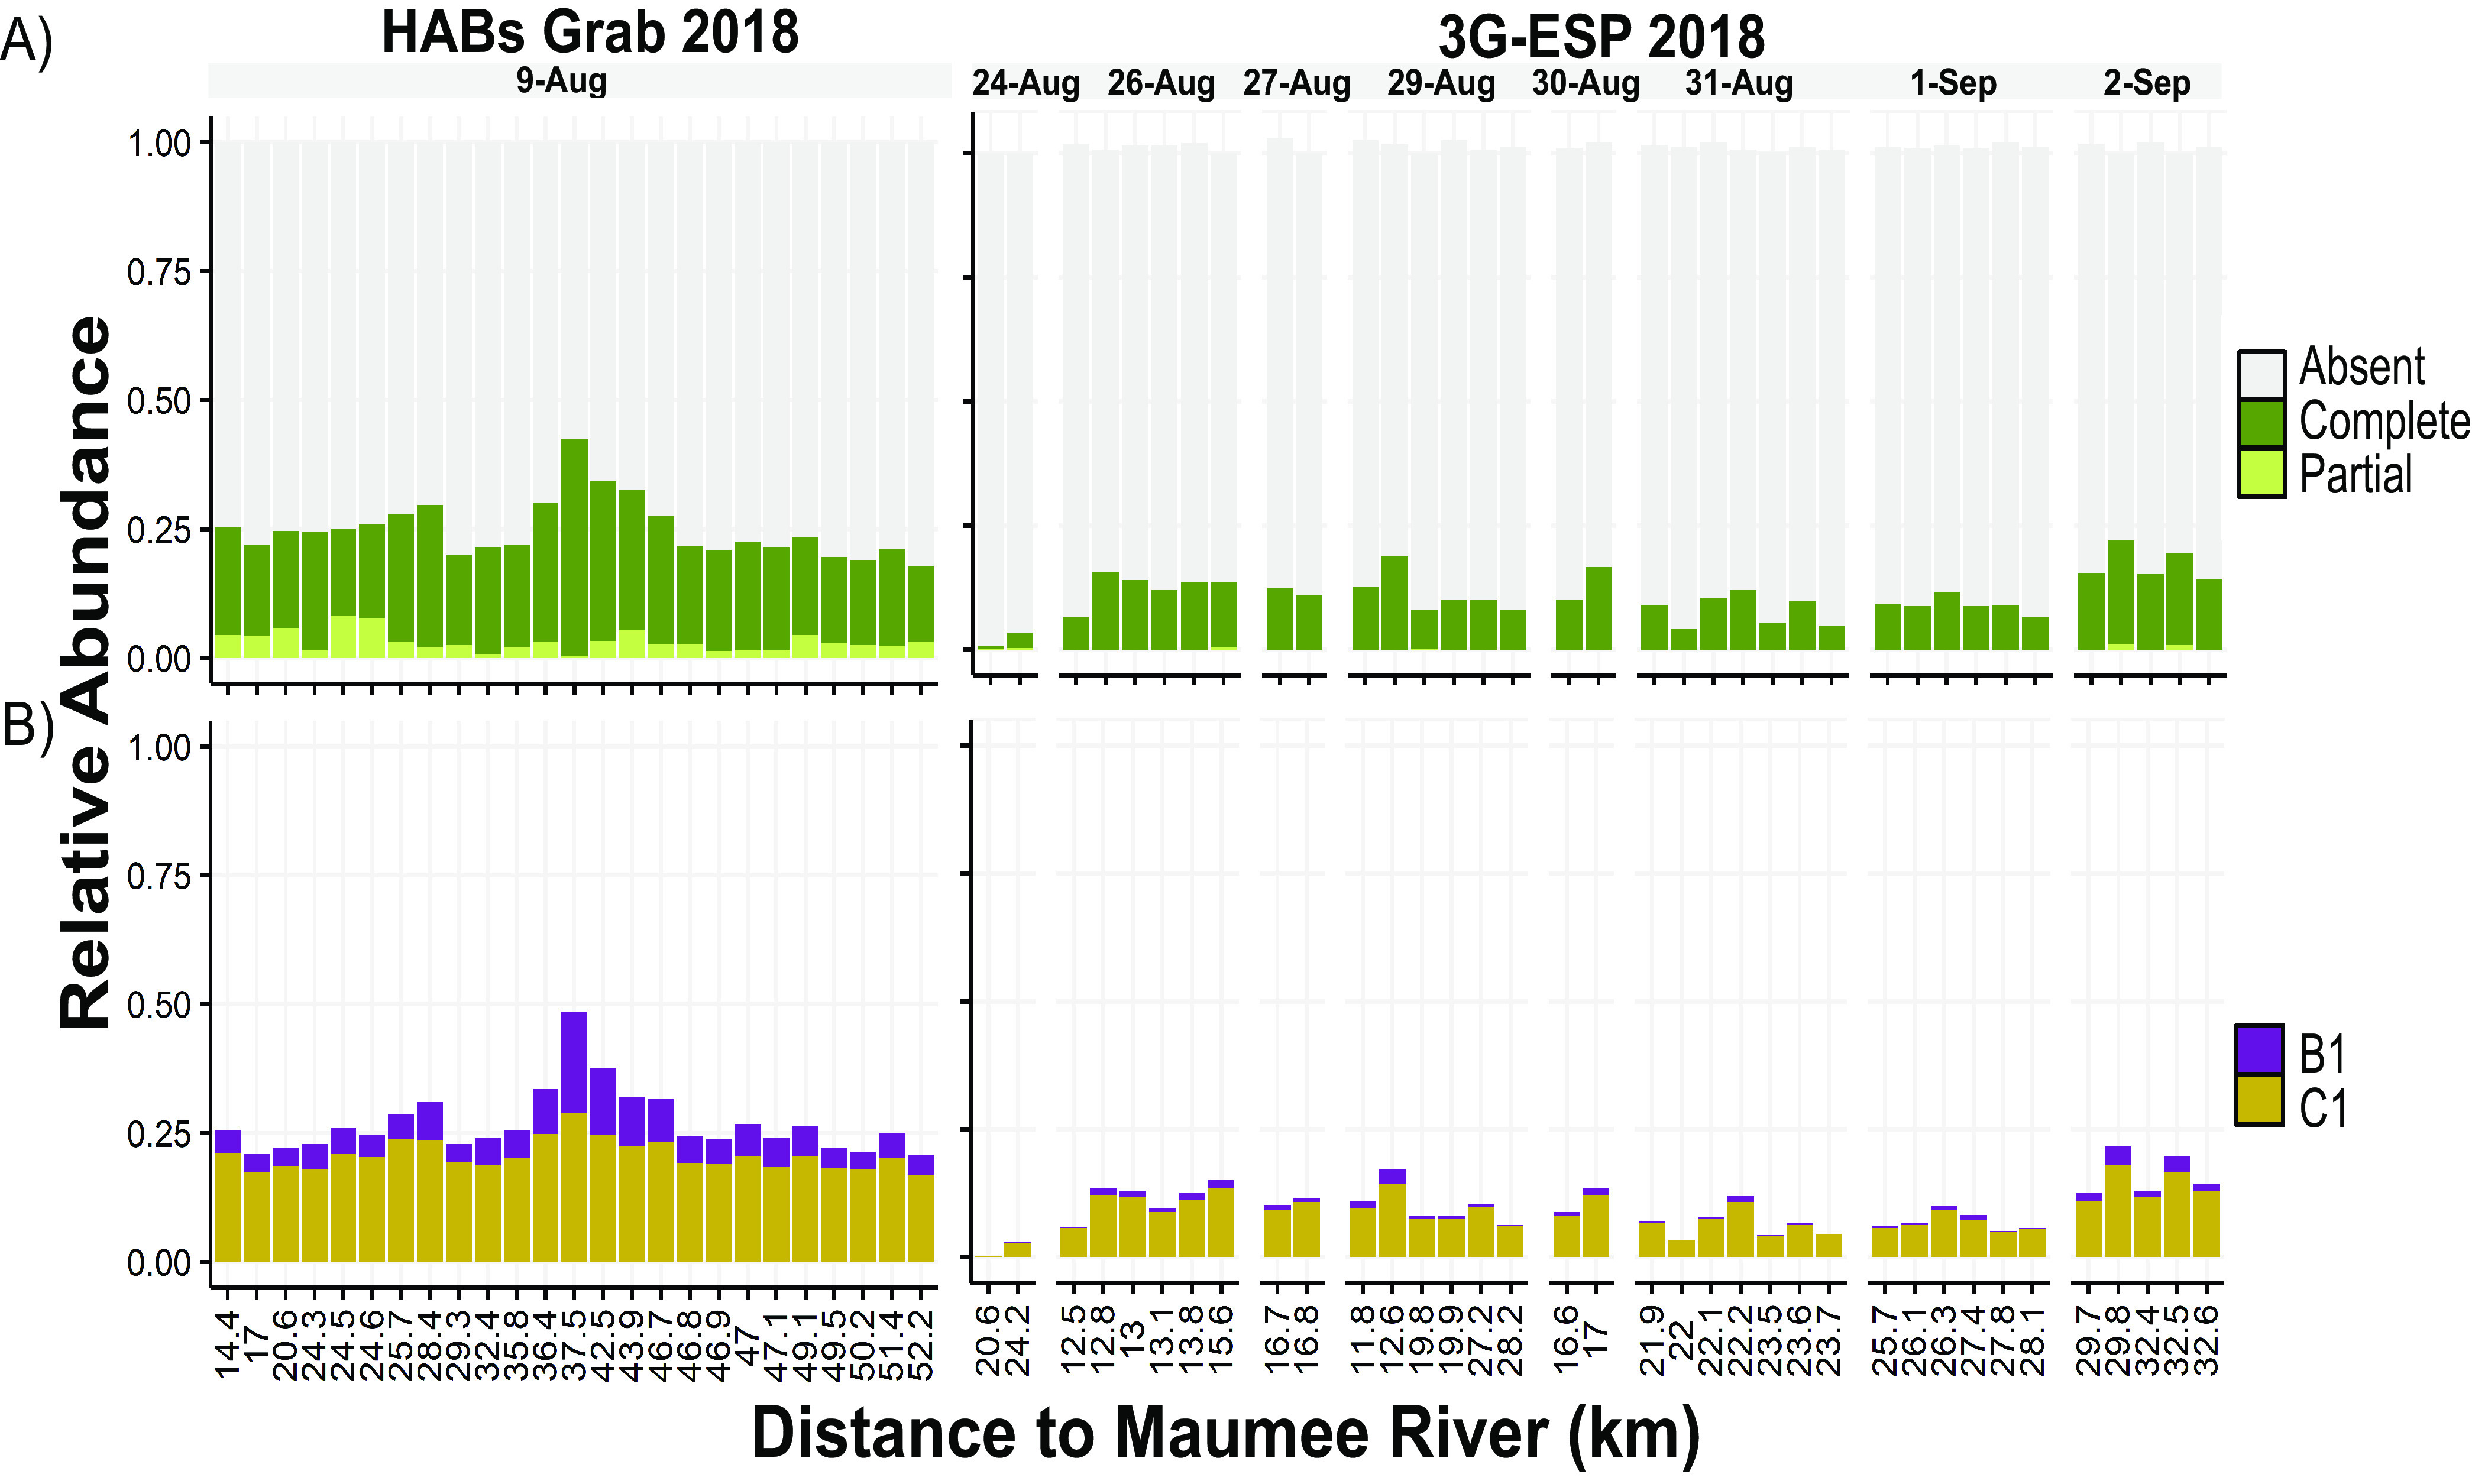
FIG 3.

Relative abundances of mcy genotypes for Microcystis populations sampled during the 2018 HABs Grab and 2018 ESP monitoring efforts. Relative abundances were calculated by taking the ratio of the coverage of mcy genes to the coverage of the V4 16S rRNA gene. The x axis is the distance from the Maumee River (kilometers) from which the sample was collected. (A) Proportion of the population containing a complete, partial, or absent mcy operon. (B) Proportion of the population containing the C1-like or B1-like mcyB variant for both the 2018 HABs Grab and 3G-ESP sampling efforts.
