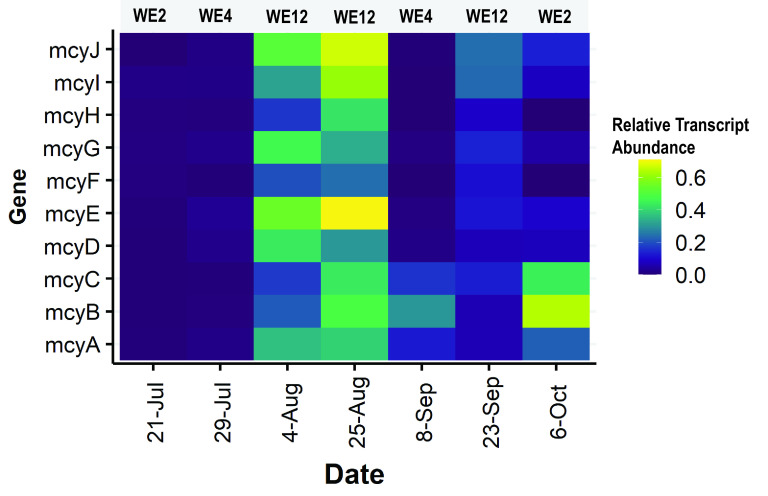
FIG 5.
Heatmaps showing the relative abundances of metatranscriptomic reads mapped to the mcy operon. Relative abundance is determined by calculating the coverage of the gene of interest (number of transcript reads mapped divided by gene length) divided by the coverage of transcripts mapped to the entire genome divided by genome length.

