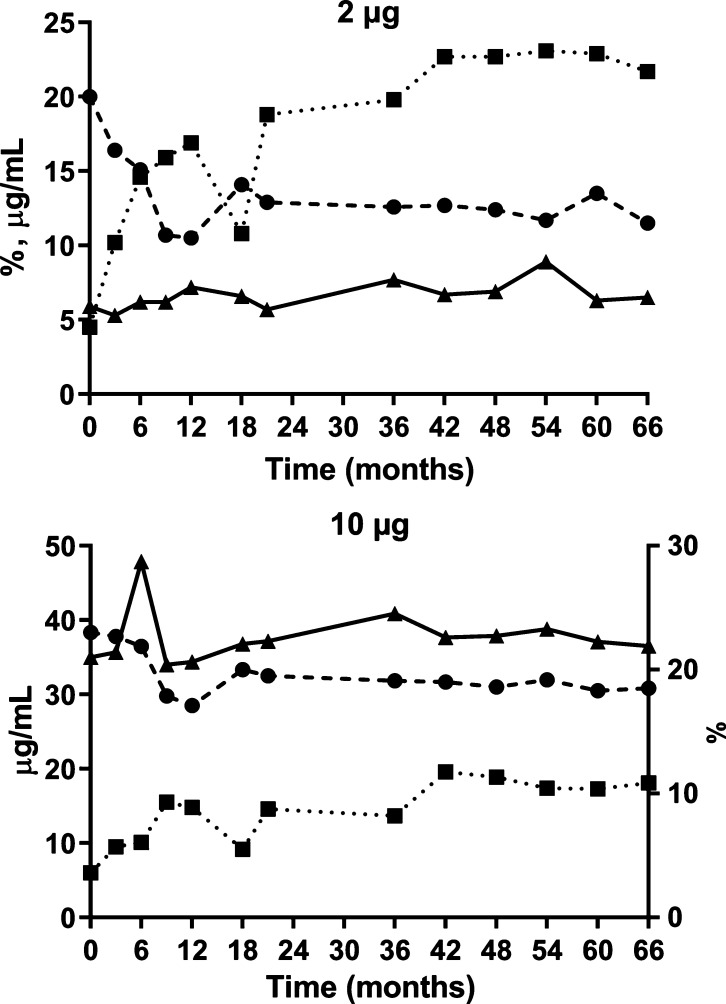
Figure 3.
Real-time stability of the SF2a-TT15 clinical batch for two different formulations. Top panel: 2 μg carbohydrate equivalent per vaccine dose (amount of SF2a-TT15 corresponding to 8 μg of carbohydrate per mL). Bottom panel: 10 μg of carbohydrate equivalent per vaccine dose (amount of SF2a-TT15 corresponding to 40 μg of carbohydrate per mL). x-axis: Time (months), (●) aggregation (%, average of two replicates); (■) free carbohydrate content (% of total carbohydrate, average of three replicates, SD < 0.1%); (▲) total carbohydrate content (μg/mL, average of three replicates, SD < 0.1%). SD: standard deviation (not shown).

