
Figure 1.
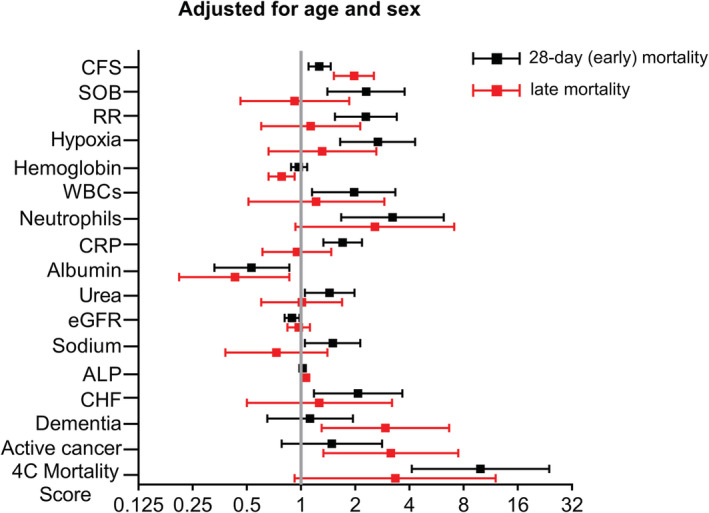
Forest plots showing odds ratios and 95% confidence intervals of independent predictors for early (28 day) and late mortality after adjustment for age and sex. Odds ratios correspond to 1‐unit increase in Clinical Frailty Scale (CFS) score, 10 breaths per minute increase in respiratory rate (RR), 10 g/L increase in haemoglobin levels, 10 × 109/L increase in number of neutrophils, 100 mg/L increase in C‐reactive protein (CRP), 10 g/L increase in albumin, 10 mmol/L increase in urea levels, 10 mL/min/1.73 m2 increase in estimated glomerular filtration rate (eGFR), 10 mmol/L increase in sodium levels, and 10‐unit increase in 4C mortality score. OR for white blood cells (WBCs) corresponds to the presence of leukocytosis (>12 × 109/L WBCs) or leukopenia (<4 × 10⁹/L WBCs). X‐axis is log2‐transformed for visual clarity. ALP, alkaline phosphatase; CHF, congestive heart failure; SOB, shortness of breath.