Figure 2.

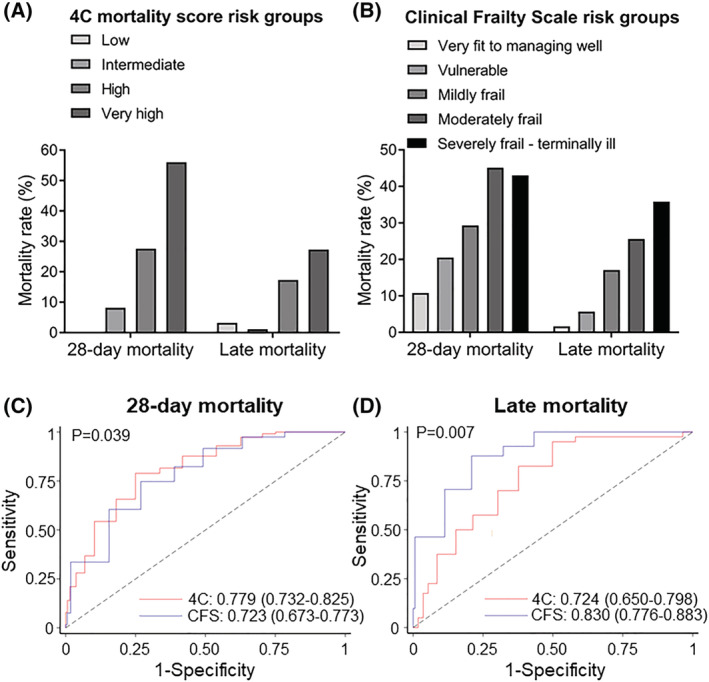
(A, B) Mortality rate in COVID‐19 patients according to 4C mortality score and Clinical Frailty Scale (CFS) risk groups. (A) Patients were classified according to 4C mortality score in four groups: low risk (4C: 0–3; n = 31), intermediate risk (4C: 4–8; n = 97), high risk (4C: 9–14; n = 232), and very high risk (4C: ≥15; n = 75). Bars represent mortality rate at 28 days after admission (early mortality) and between 29 days and 8 months (late mortality). (B) Early and late mortality according to CFS in five groups: very fit to managing well (CFS 1–3; n = 195), vulnerable (CFS 4; n = 44), mildly frail (CFS 5; n = 58), moderately frail (CFS 6; n = 71), and severely frail/terminally ill (CFS 7–9; n = 93). Receiver operating characteristic (ROC) curves and corresponding area(s) under the curve (AUC) for (C) early (28 day) and (D) late mortality in patients hospitalized with COVID‐19. The discriminatory performance of the 4C mortality and CFS scores for the occurrence of death is graphically assessed by corresponding ROC curves, and AUCs are compared with derive P‐values using the χ 2 distribution with one degree of freedom.
