FIGURE 3.

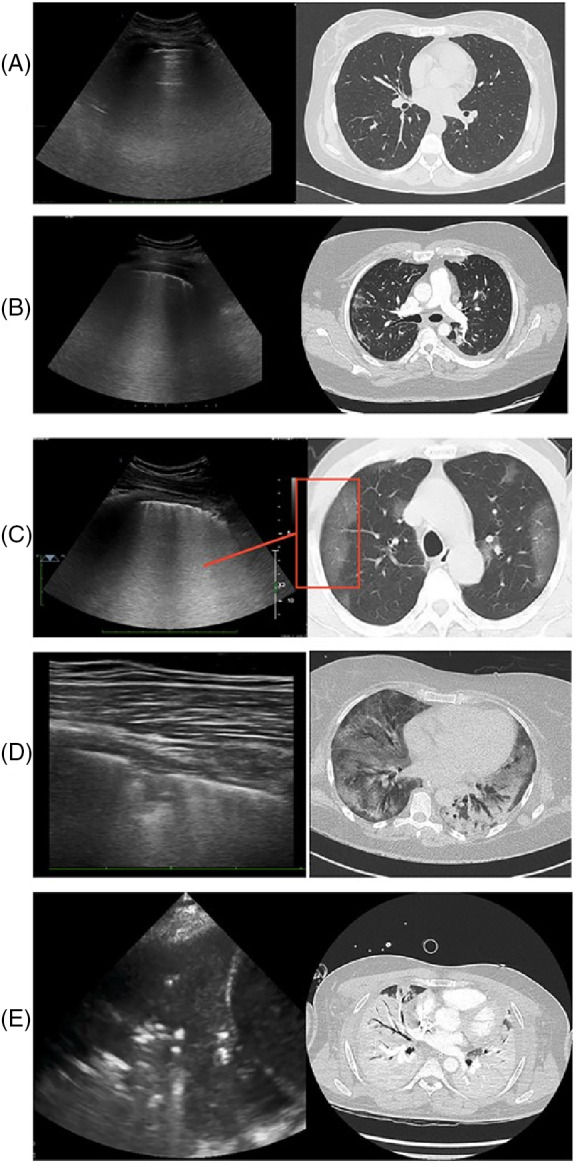
PUS and CT images of the lungs of individuals affected by COVID‐19 at different stages, from normal aeration (A), progressive deaeration states (B and C) small and peripheral consolidation (D) and large consolidation (E). Adapted from 28

PUS and CT images of the lungs of individuals affected by COVID‐19 at different stages, from normal aeration (A), progressive deaeration states (B and C) small and peripheral consolidation (D) and large consolidation (E). Adapted from 28