. 2022 May 10;12(22):14052–14060. doi: 10.1039/d2ra00346e

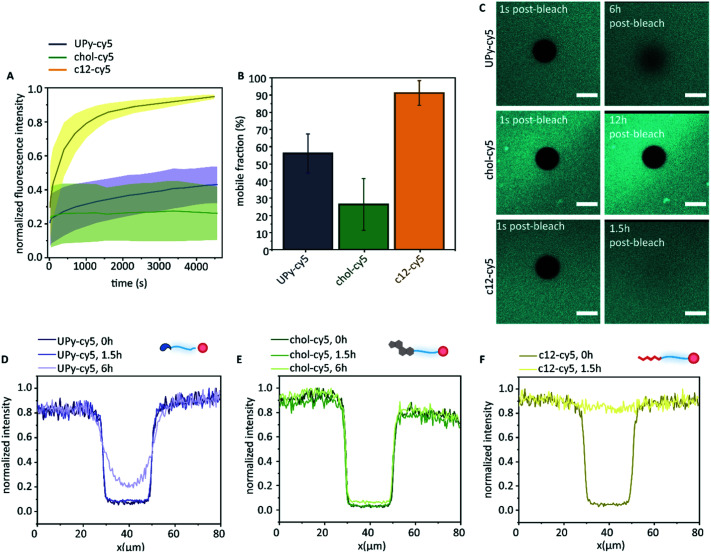
Fig. 5. Exchange dynamics of the guests in the host hydrogel. The normalized fluorescence intensity of the different cy5 functionalized guests after photobleaching (A), and the fraction of fluorescence intensity that recovers when fluorescence intensity reaches a plateau (B, mobile fraction), data is represented as ±SD, n = 3. The confocal micrographs of the different cy5-labeled guest molecules directly post-bleaching, and the UPy–cy5 visualized 6 h post-bleaching, the chol–cy5 visualized 12 h post-bleaching, and c12–cy5 visualized 1.5 h post-bleaching (C, scale bar represents 20 μm). The measured intensity profile for the bleached spots after 0 hour, 1.5 hour, and 6 hours post-bleaching of (D) UPy–cy5, (E) chol–cy5, and (F) c12–cy5.

Fig. 5