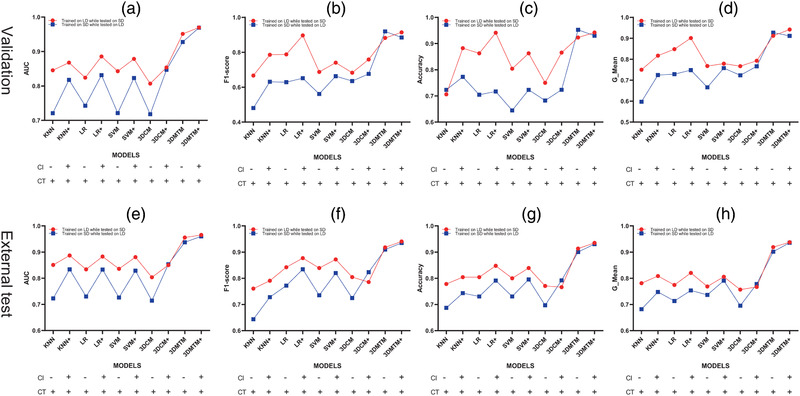
FIGURE 4.

Performance evaluation of proposed models in the discrimination between COVID‐19 and CAP on validation and external test sets. Area under the receiver operating characteristic curve (AUC), F1‐score, accuracy and G‐mean were utilized to evaluate the model performance. Of note, two sets of models were developed with switched training and validation sets and both tested on another external test set. (a–d) models performance on validation sets (plotted on diagram according to the metrics values); (e–h) models performance on external test set (plotted on diagram according to the metrics values). CAP, community‐acquired pneumonia; CI, clinical information; COVID‐19, coronavirus disease 2019; CT, computed tomography; KNN, k‐nearest neighbor; LD, large dataset; LR, logistic regression; SD, small dataset; SVM, support vector machine; 3D CNN, 3 dimensional convolutional neural network; 3DMTM, 3D‐MIL‐LSTM model
